 100% Free
Heat Map for PowerPoint and Google Slides
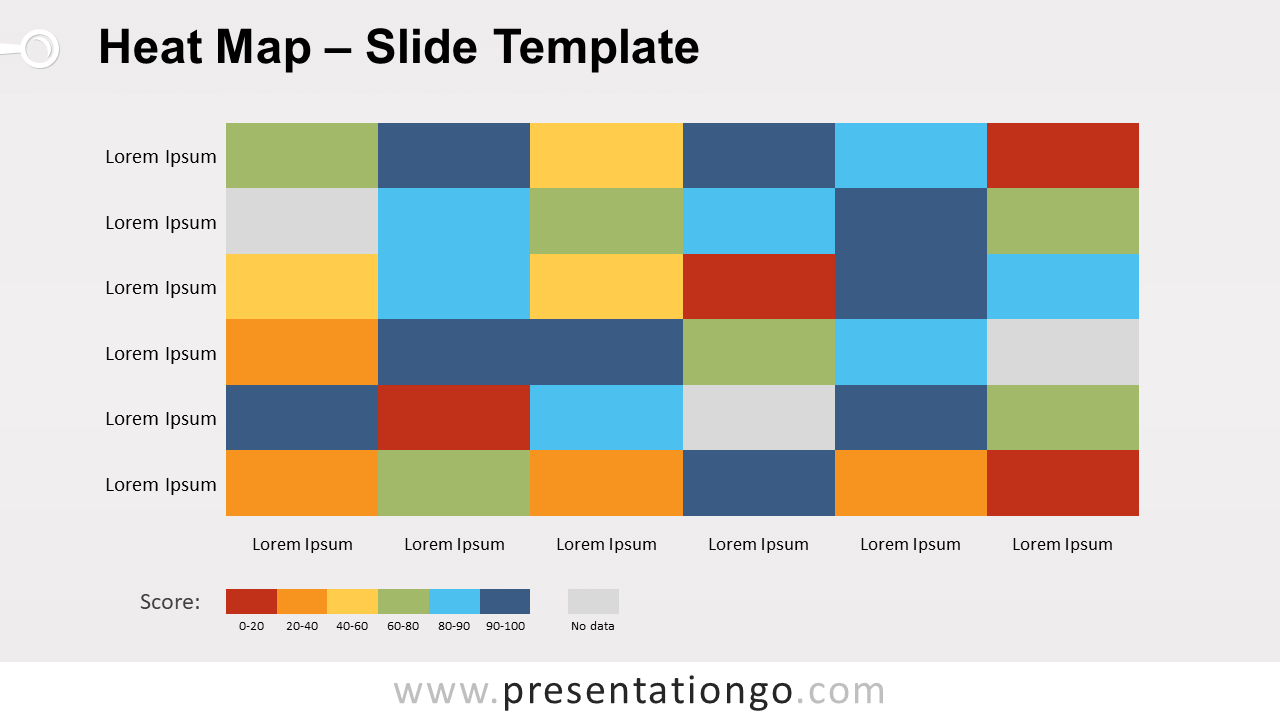
Free heat map for PowerPoint and Google Slides. A two-dimensional data visualization chart with 2 color scheme options: by hue or intensity.
Template Details
Free heat map for PowerPoint and Google Slides. A two-dimensional data visualization chart with color variations. 2 color scheme options: by hue or intensity. Editable graphics. Basically, a heat map chart is a type of chart that uses different colors to represent data values in a table. More specifically, that is a two-dimensional representation of information. The colors of the cells vary depending on data ranges. In fact, heat maps are a great way to make complex data very easy to visualize. This slide template offers a representation of a 6 by 6 table (or 6×6 matrix). That means that you have six items in rows and as many in columns. The shapes and text boxes are editable, so you can adapt it to your needs. Also, you will find in the document 2 color scheme options : multicolor (by hue) or with variants of a single color (i.e., by intensity). Heat maps will give your attendance a more visual overview of your results. In fact, you can use this chart to plot data about many different topics, like for analytics, performance analysis, human resources, polls, etc.
- Source
- PresentationGo
- Format
- pptx
- File size
- 77 KB
- Downloads
- 0
- Slides
- 3
- Aspect Ratio
- 16:9
Author / Copyright:PresentationGo
Original source:PresentationGo original