 100% Free
Infographic Block Cycle for PowerPoint and Google Slides
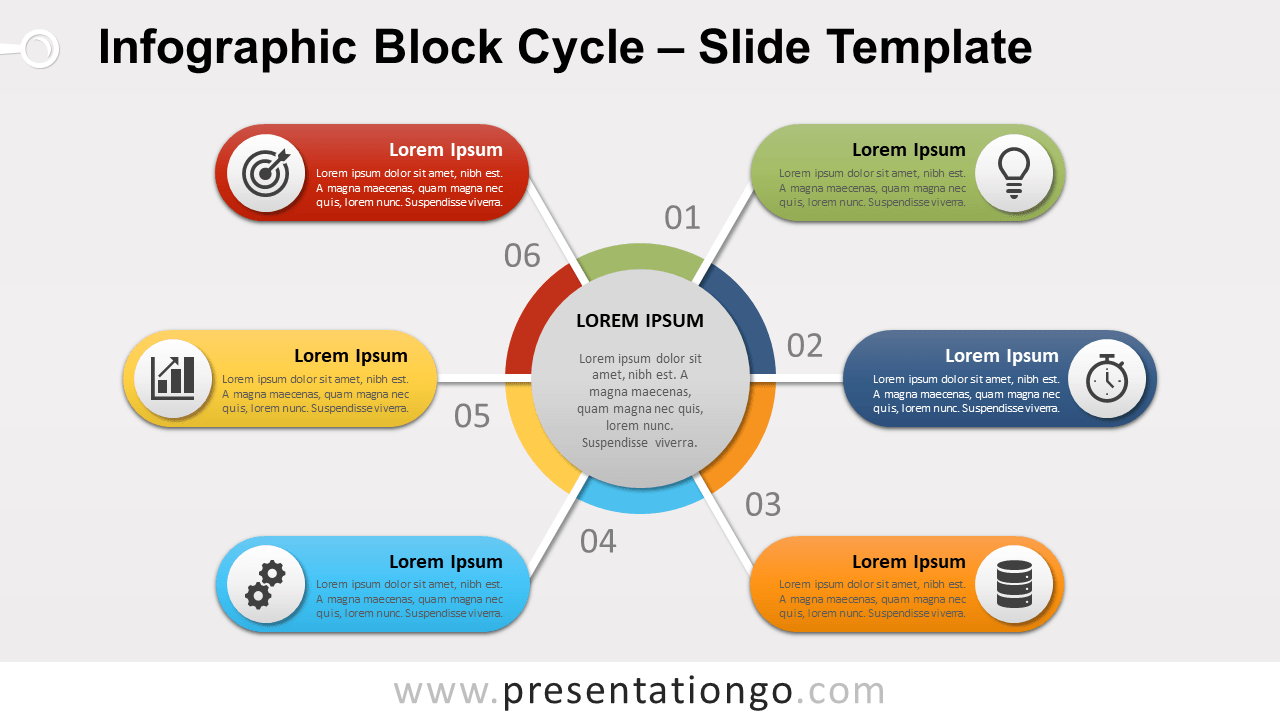
Free infographic block cycle for PowerPoint and Google Slides. Pie chart with 6 equal parts. Colorful text blocks connected to the central circle.
Template Details
Free infographic block cycle for PowerPoint and Google Slides. Pie chart with 6 equal parts, a circle shape in the middle. Colorful text blocks connected to the central circle. Editable graphics with numbers, icons, and text placeholders. Use this circular diagram to illustrate 6 ideas , concepts, or groups of information. You can also use it to represent a continuing sequence of 6 stages , tasks, or events in a circular flow . Additionally, you can use this diagram to show how 6 individual and interconnected parts form a whole. This infographic template will finally be great to illustrate the relationship to a central idea : emphasizes both information in the center diagram and how information in the outer shapes contributes to the central idea in a cyclical progression.
- Source
- PresentationGo
- Format
- pptx
- File size
- 97 KB
- Downloads
- 0
- Slides
- 2
- Aspect Ratio
- 16:9
Author / Copyright:PresentationGo
Original source:PresentationGo original