 100% Gratis
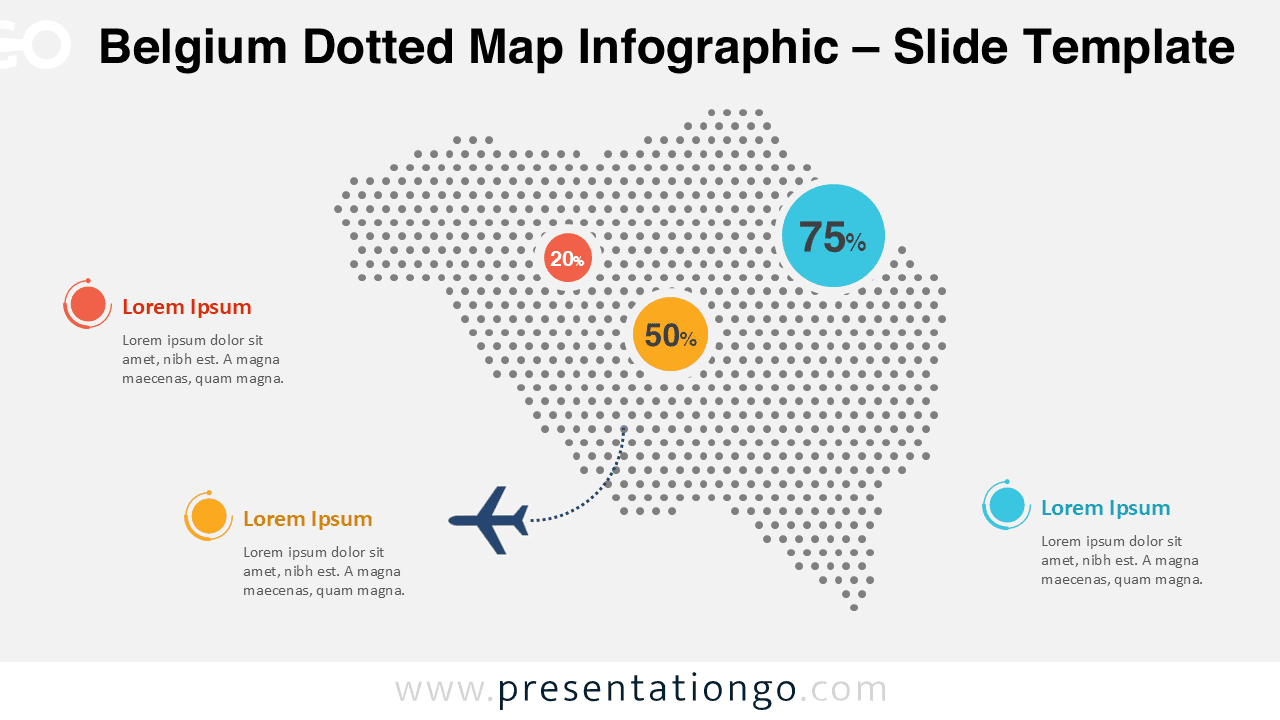
Belgium Dotted Map Infographic
Download a free Belgium dotted map infographic for PowerPoint and Google Slides. Perfect for geographic data, reports, and business presentations.
Detalles de la plantilla
The Belgium Dotted Map Infographic is a clean and modern visual solution designed to help you present geographic data clearly in PowerPoint and Google Slides. Built with evenly spaced dot patterns, this map highlights the shape of Belgium while keeping the design minimal and professional. This infographic is ideal for business reports, market analysis, logistics planning, and educational content. Its structured dot layout allows you to add markers, percentages, or labels without overwhelming your audience. The result is a balanced visual that supports data-driven storytelling.
- Fuente
- PresentationGo
- Formato
- pptx
- Tamaño
- 174 KB
- Descargas
- 0
Autor / Copyright:PresentationGo
Fuente original:PresentationGo original