 100% Gratis
Equalizer Chart for PowerPoint
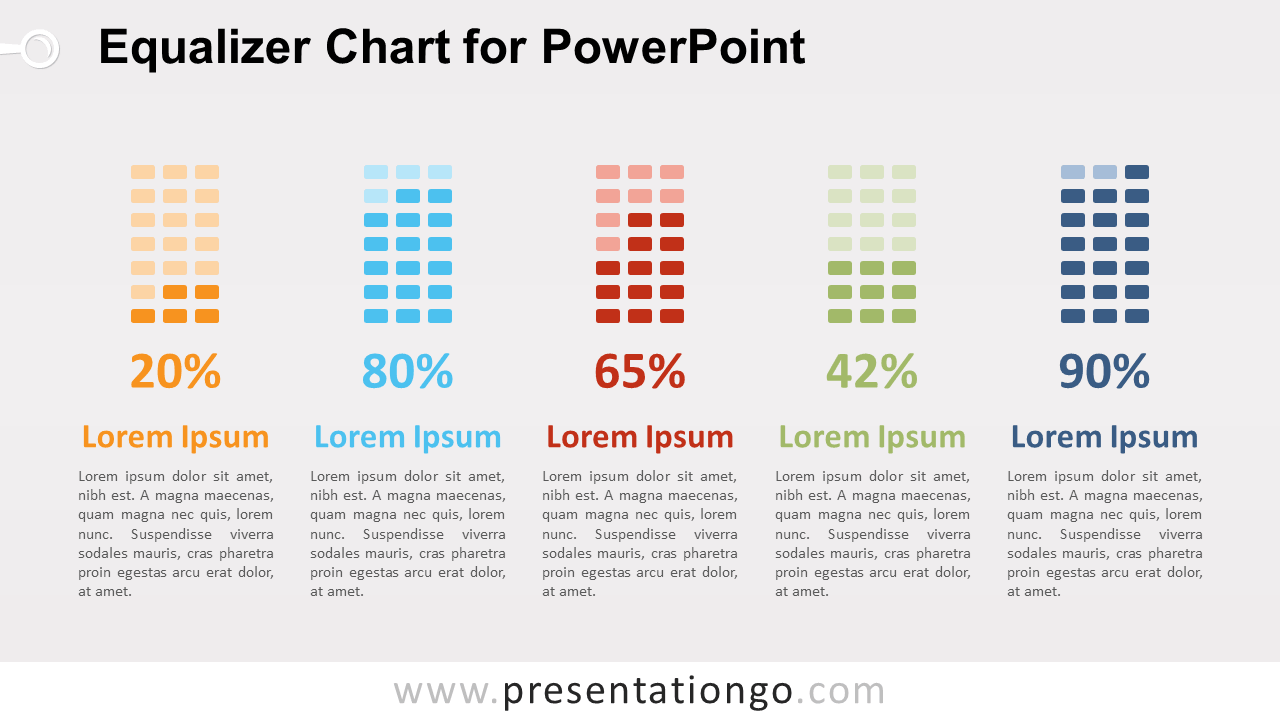
Free equalizer chart for PowerPoint with 5 vertical level indicators. Editable graphics with text placeholder. Use this diagram to compare quantitative data
Detalles de la plantilla
Free equalizer chart for PowerPoint with 5 vertical level indicators. Editable graphics with text placeholder. Usage: fill the rounded rectangles with darker colors according to the percentage. There are 3×7 rectangles, meaning each one equals 5 (approximatively). Therefore if your number was 34, you should highlight 7 rectangles.
- Fuente
- PresentationGo
- Formato
- pptx
- Tamaño
- 79 KB
- Descargas
- 0
- Diapositivas
- 2
- Relación
- 16:9
Autor / Copyright:PresentationGo
Fuente original:PresentationGo original