 100% Gratis
Pancake Charts for PowerPoint and Google Slides
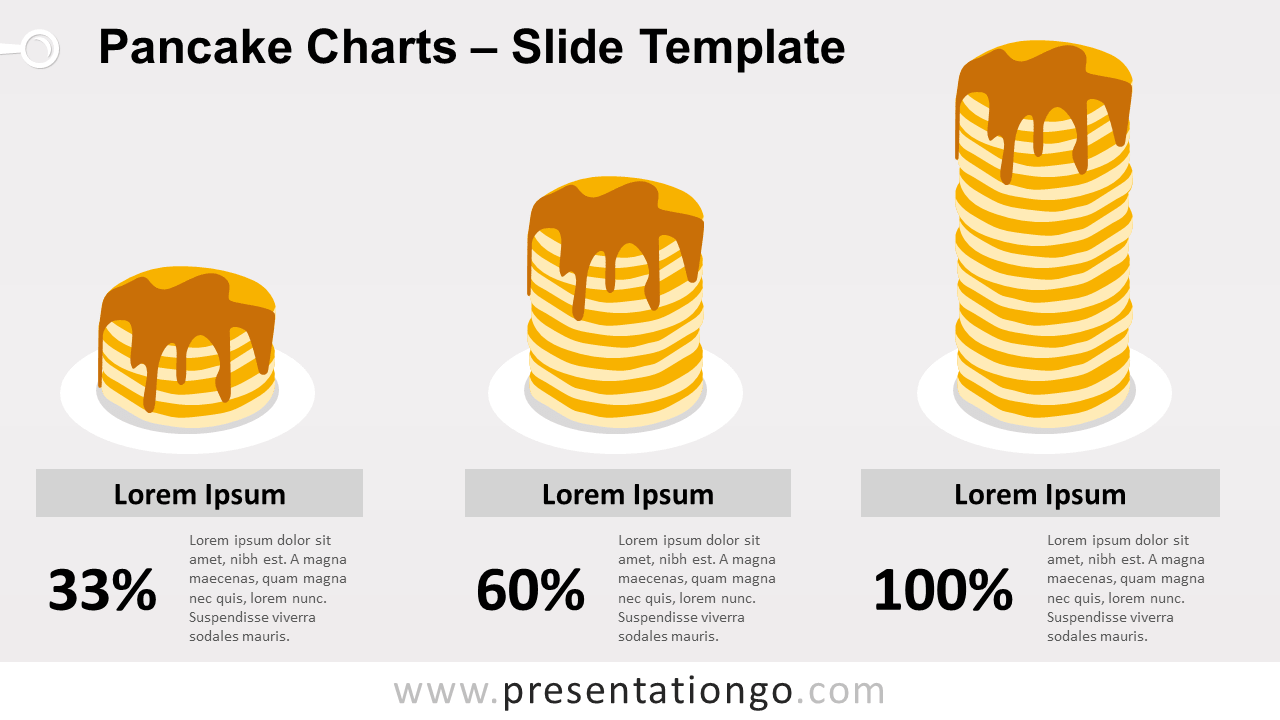
Free pancake charts for PowerPoint and Google Slides. This adjustable pile of pancakes is a fun alternative to show quantitative data. Editable graphics.
Detalles de la plantilla
Free pancake charts for PowerPoint and Google Slides. This adjustable pile of pancakes is a fun alternative to show quantitative data. Non-data-driven yet editable graphics. This infographic chart is a fun way to show percent data. Additionally, it is a non-data-driven chart alternative, meaning that you can’t link it to real data. Just pile up your pancakes and adjust the height with as many pancakes as needed according to your quantitative information. This graphic can be used for any purpose, but it will suit more specifically illustrations about food in general.
- Fuente
- PresentationGo
- Formato
- pptx
- Tamaño
- 87 KB
- Descargas
- 0
- Diapositivas
- 2
- Relación
- 16:9
Autor / Copyright:PresentationGo
Fuente original:PresentationGo original