 100% Gratis
Radial Gauge Chart for PowerPoint and Google Slides
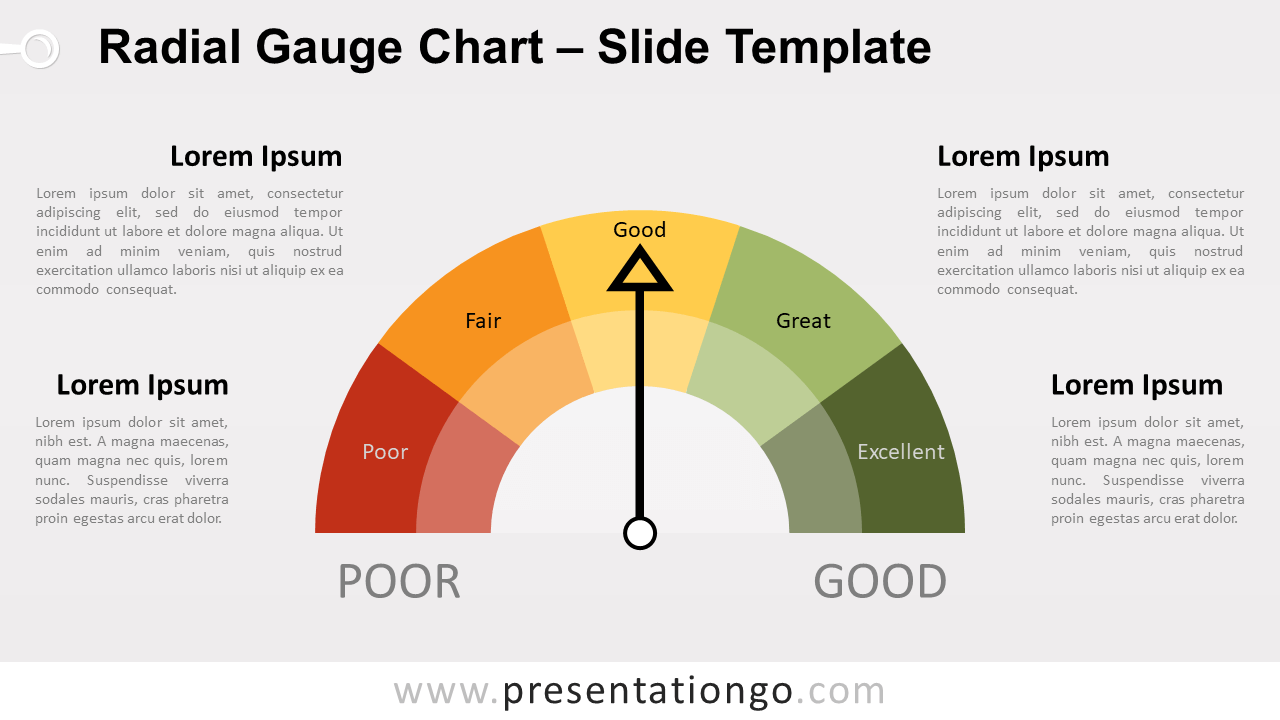
Free radial gauge chart for PowerPoint and Google Slides. Semi-circular arc speedometer with 5 or 6 ranges and rotating needle. Editable graphics.
Detalles de la plantilla
Free radial gauge chart for PowerPoint and Google Slides. Semi-circular arc speedometer with 5 or 6 ranges and rotating needle. Editable graphics with text placeholders. You are probably quite familiar with this kind of chart. A gauge chart (aka speedometer ) combines a donut (or doughnut) chart and a pie chart. They are usually used to indicate a relative score. It helps visualize a score versus a target (from low to high). Specifically, the document includes 2 variants of gauges: with 5 and 6 ranges (parts). The ranges highlight a set of continuous values bound by a specified minimum value and a maximum value. You can relate this type of chart to credit scores (in the US): a credit score goes from bad to very good. The colors, from red to green, make the score very easily understandable at a glance. This chart is not data-driven yet it is completely editable. That means that you can manually adjust and rotate the needle to the level you want (see instructions below). Just click the arrow. Then, select the rotation handle at the top of the shape, and then drag in the direction that you want:
- Fuente
- PresentationGo
- Formato
- pptx
- Tamaño
- 94 KB
- Descargas
- 0
- Diapositivas
- 4
- Relación
- 16:9
Autor / Copyright:PresentationGo
Fuente original:PresentationGo original