 100% Gratis
Thermometer Scales for PowerPoint and Google Slides
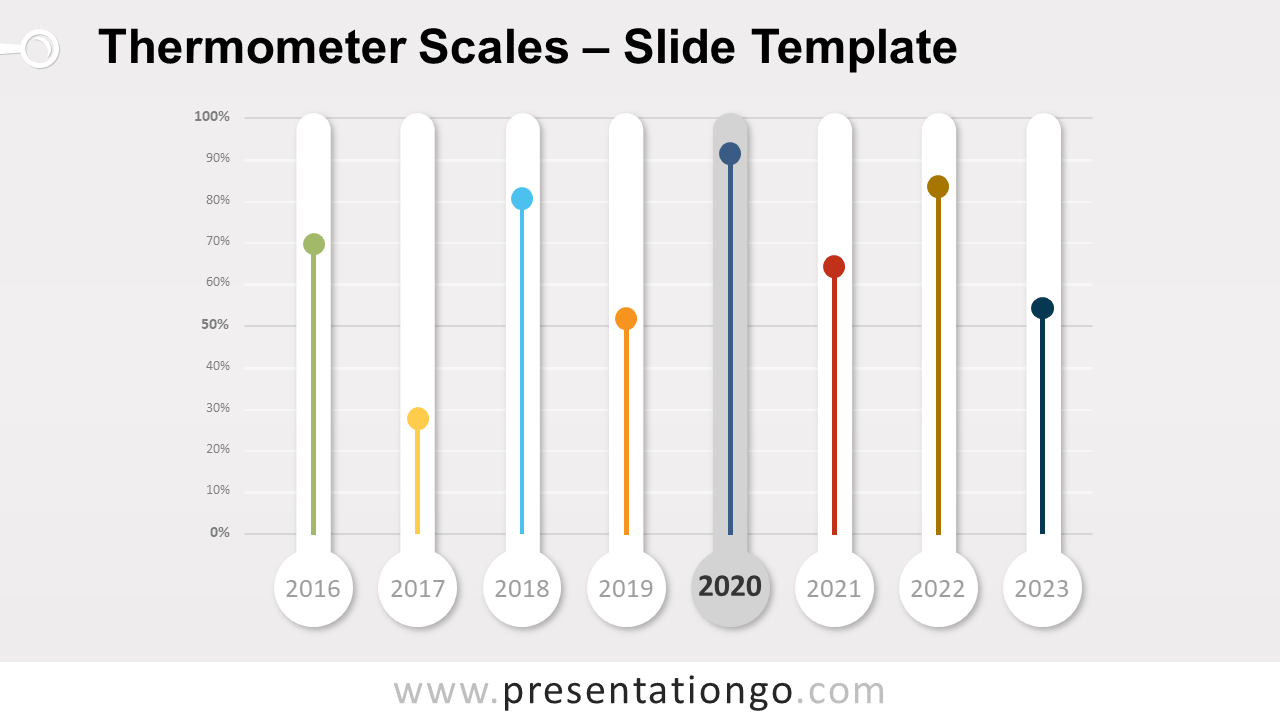
Free thermometer scales for PowerPoint and Google Slides. A non-data-driven graphic of a series of thermometer scales. Great to compare percentages.
Detalles de la plantilla
Free thermometer scales for PowerPoint and Google Slides. Non-data-driven charts of a series of thermometer scales. Great to compare percentages. Editable graphics with text placeholders. Thermometers are great graphics to show quantitative results . In fact, everybody knows and understands very easily how a thermometer works. Reading a thermometer is indeed pretty straightforward: a low level indicates it’s (freezing) cold, while a long one means it’s (very) hot. The slide template features 8 thermometer scales, side-by-side. Also, the circle shape on the bottom of each scale embeds a date. Therefore, you can use it to compare percentages over a period of time. In addition, the levels are very easy to adapt to your needs. The charts are not data-driven though. Adapt the height of the scale according to the percentages. If needed, align the vertical bar to the lowest level (0%). Then adjust the top little circle’s position.
- Fuente
- PresentationGo
- Formato
- pptx
- Tamaño
- 71 KB
- Descargas
- 0
- Diapositivas
- 2
- Relación
- 16:9
Autor / Copyright:PresentationGo
Fuente original:PresentationGo original