 100% Gratuit
Infographic Cycle Diagram for PowerPoint
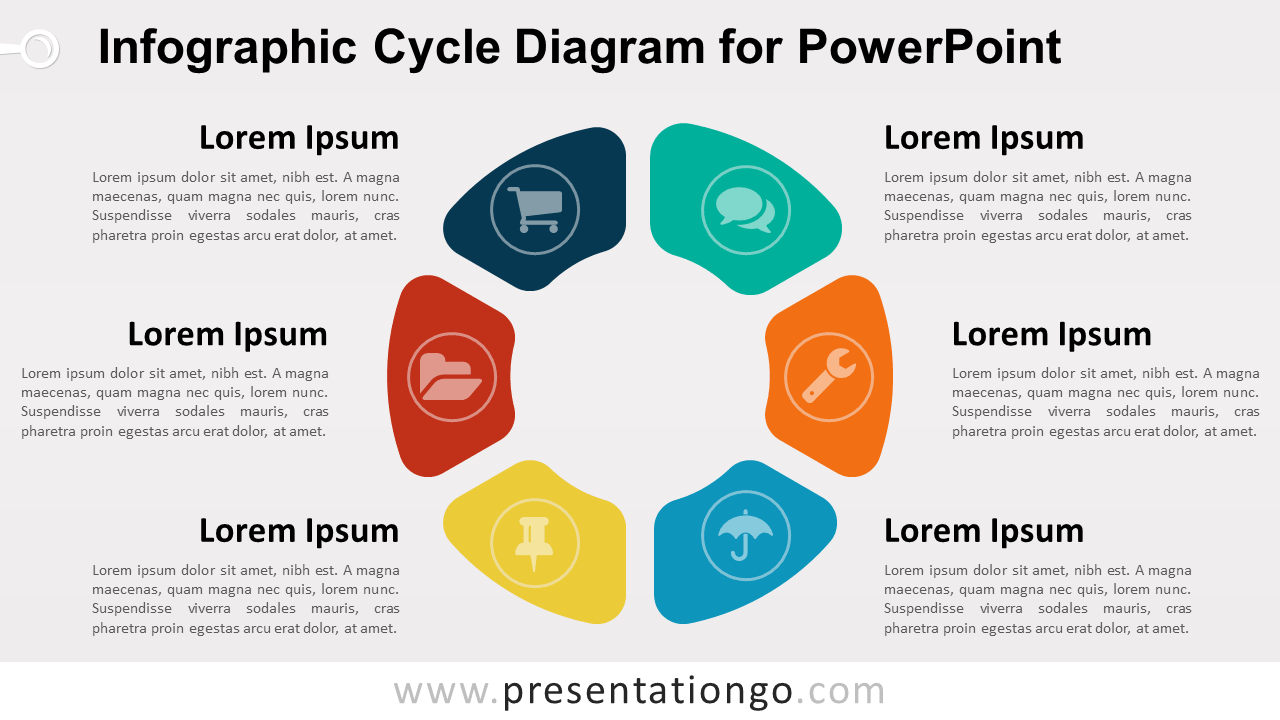
Free infographic cycle diagram for PowerPoint. Colored graphic design with 6 circular stages. Continuing sequence of 6 stages or events.
Détails du modèle
Free infographic cycle diagram for PowerPoint. Colored graphic design with 6 circular stages. Editable graphics with text placeholder. Use this diagram to represent a continuing sequence of 6 stages, tasks, or events in a circular flow. Can also be used to illustrate 6 ideas or concepts.
- Source
- PresentationGo
- Format
- pptx
- Taille
- 106 KB
- Téléchargements
- 0
- Diapositives
- 2
- Format
- 16:9
Auteur / Copyright:PresentationGo
Source d’origine:PresentationGo original