 100% Gratuit
Syringe Chart for PowerPoint
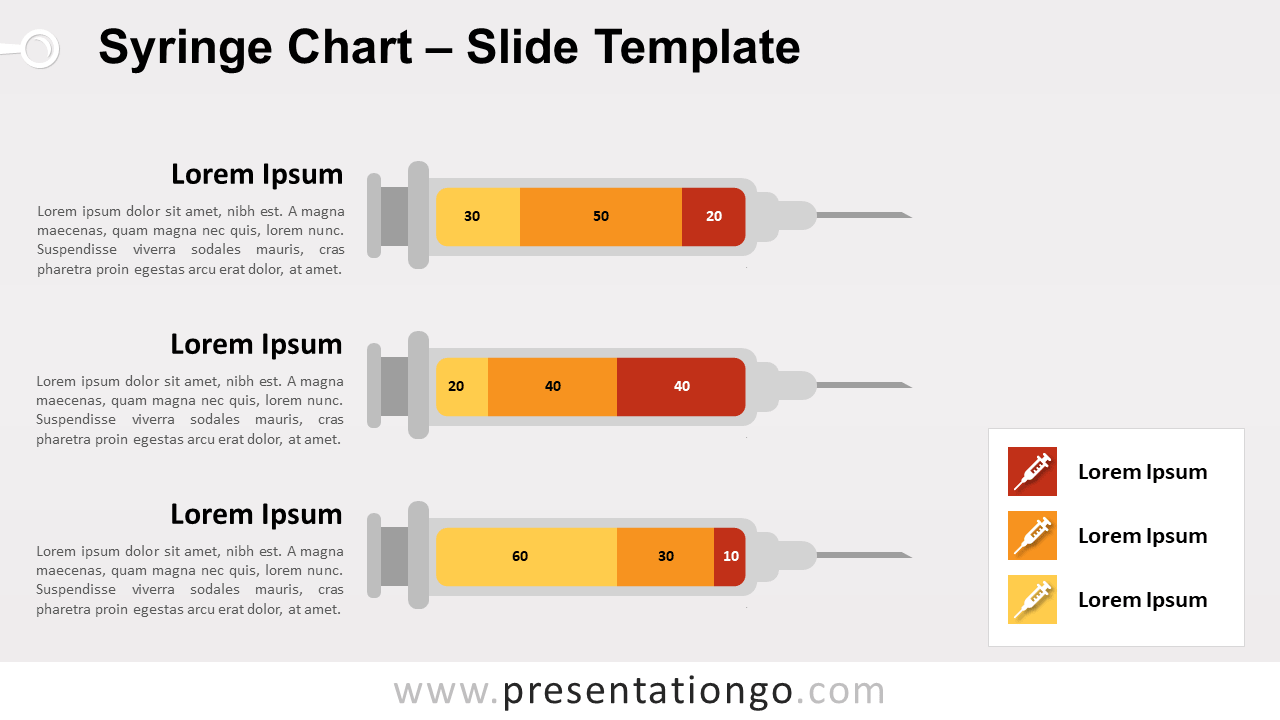
Free syringe chart for PowerPoint and Google Slides. 3 syringes and data-driven bar chart. Great for presentations about medicine, drugs, vaccine.
Détails du modèle
Free syringe chart for PowerPoint and Google Slides. Illustration of three (3) syringes with a needle and data-driven bar chart. Flat design style. Editable graphics with text placeholders. Use this infographic chart in your presentation to compare quantitative results . These syringe charts will be perfect for any topics related to medicine , healthcare, hospital, drugs, vaccine, or pharmacy. Built-in data driven PowerPoint chart: made with stacked bar chart, you can easily change data series and format (e.g., colors).
- Source
- PresentationGo
- Format
- pptx
- Taille
- 146 KB
- Téléchargements
- 0
- Diapositives
- 2
- Format
- 16:9
Auteur / Copyright:PresentationGo
Source d’origine:PresentationGo original