 100% 無料
1-Month Gantt Chart
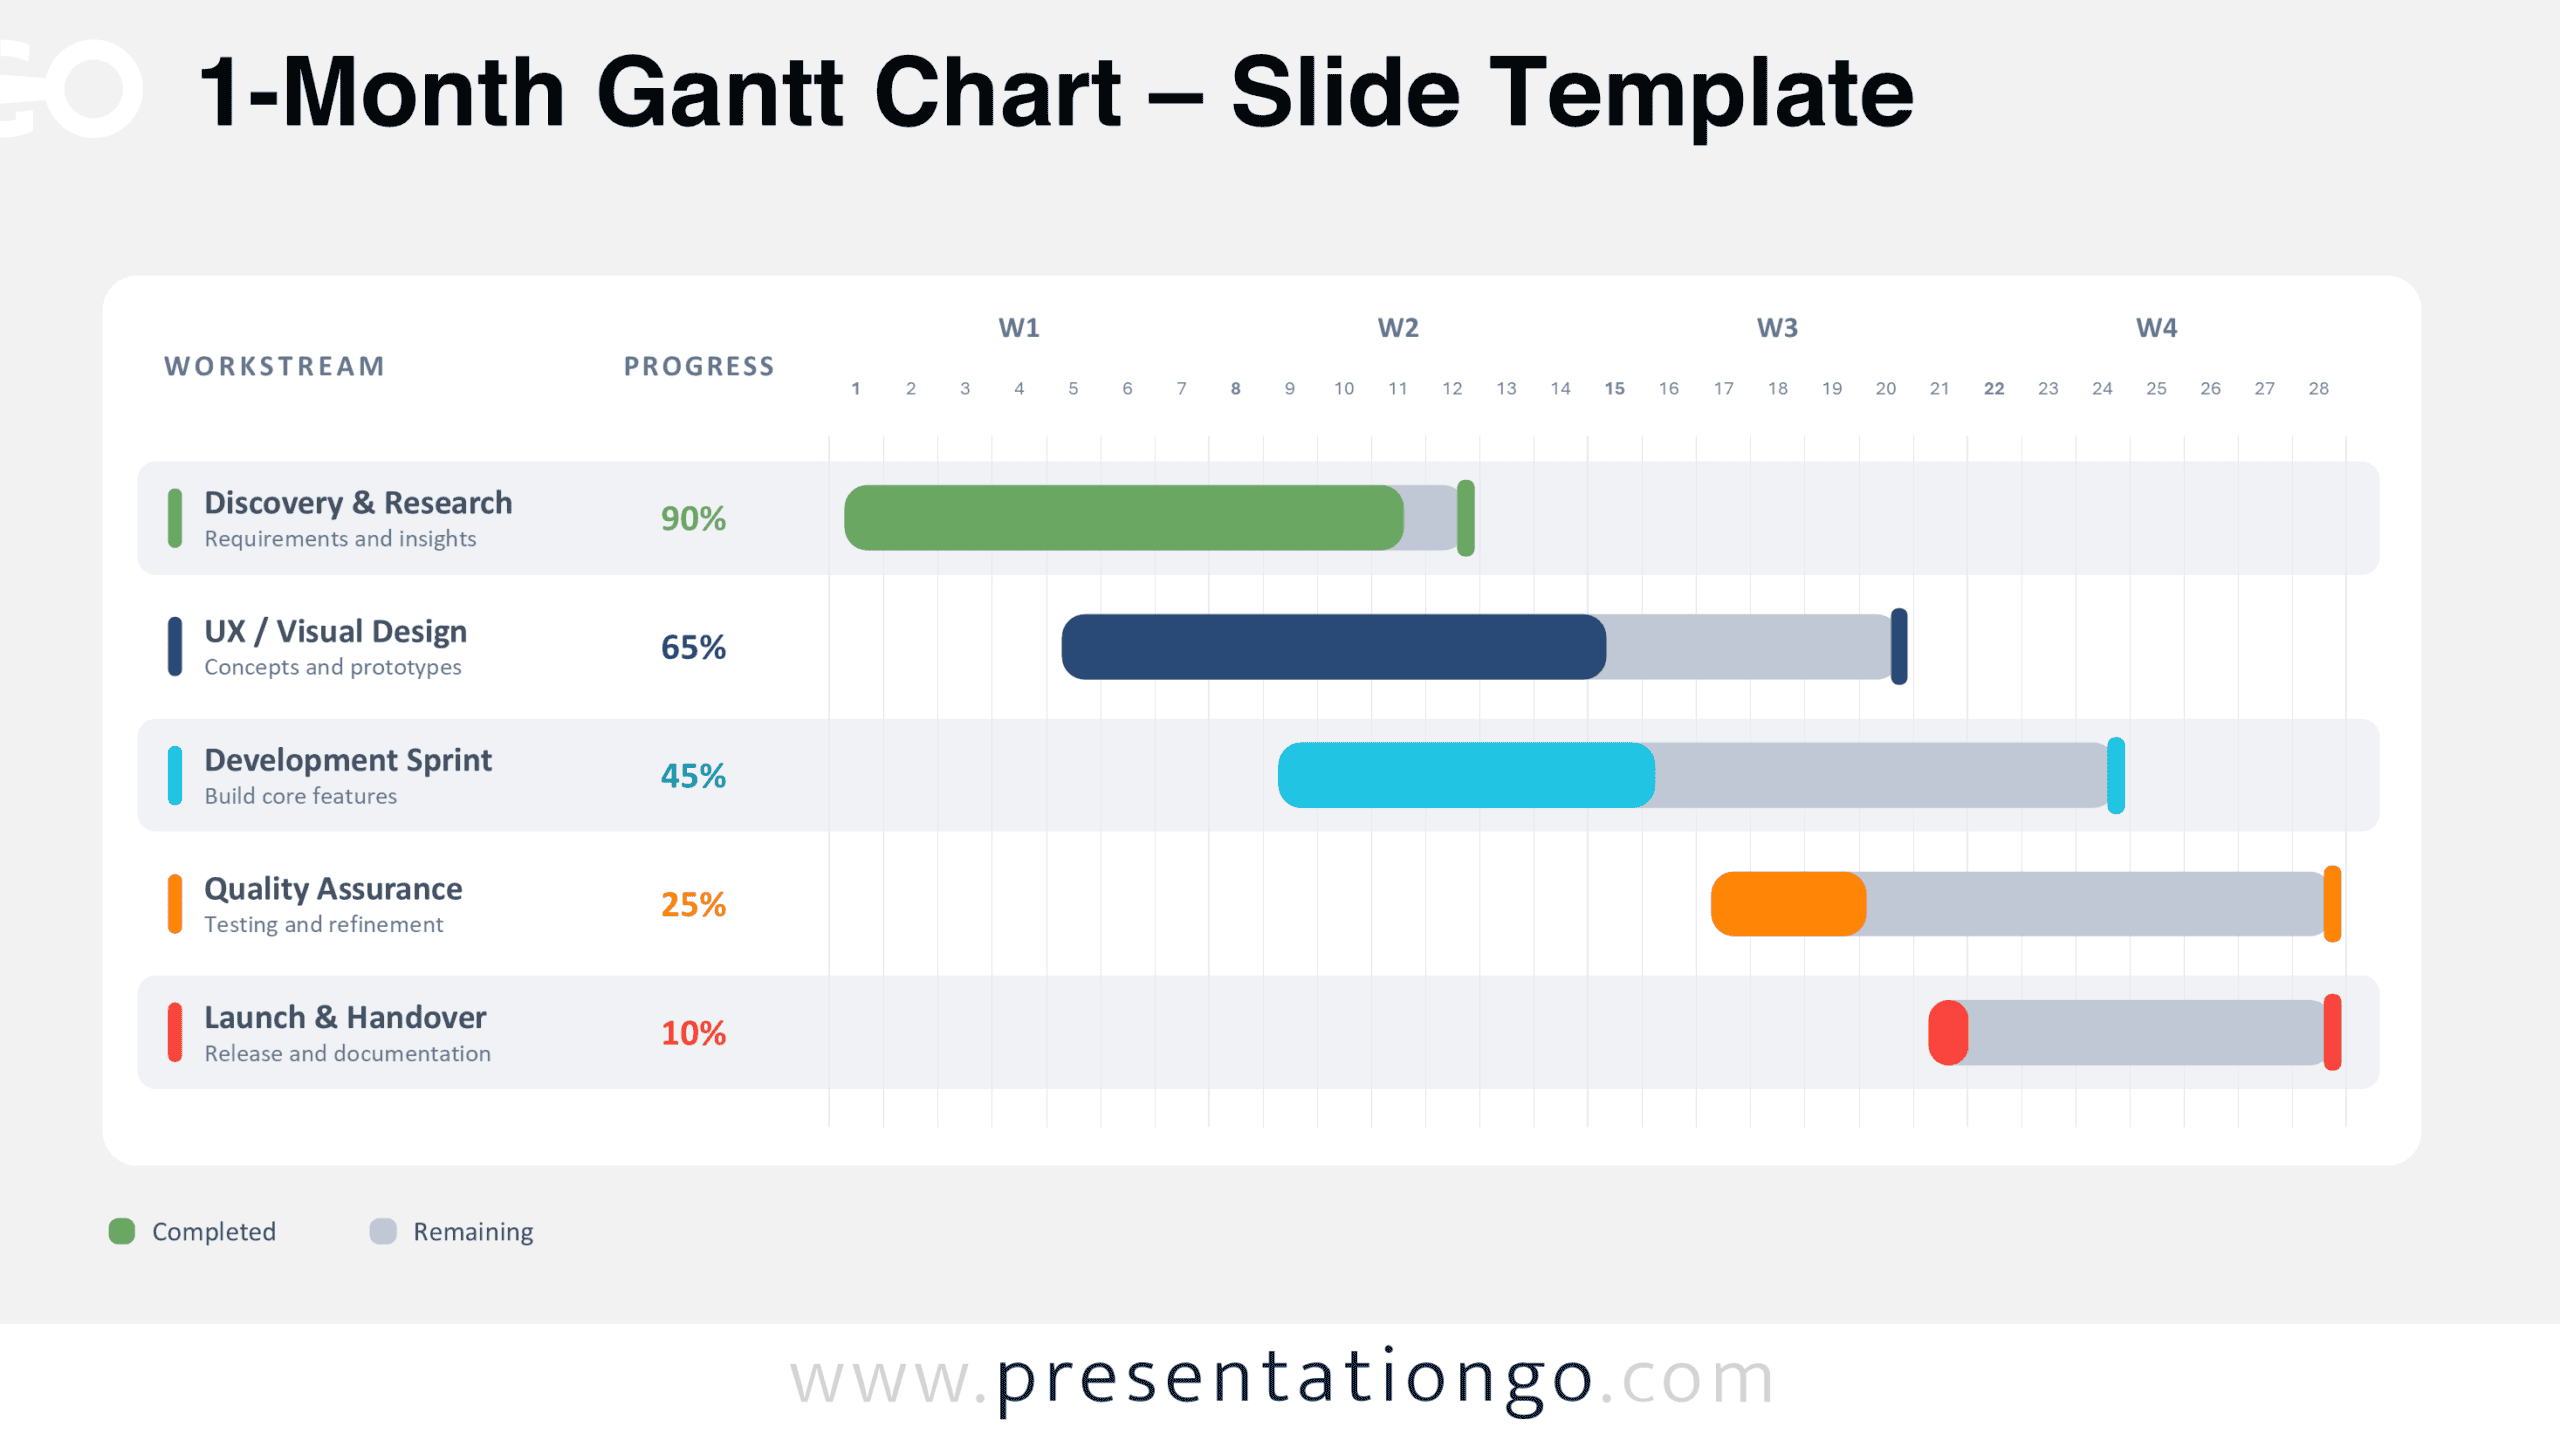
Download a free 1-Month Gantt Chart for PowerPoint and Google Slides. Track five workstreams across four weeks with editable task bars and progress indicators.
テンプレートの詳細
The 1-Month Gantt Chart is a free, editable diagram for PowerPoint and Google Slides that presents project schedules over four weeks. Its 28-day timeline combines five workstreams, task durations, and completion percentages in one view. Use it to coordinate activities, review progress, and communicate upcoming deadlines during project meetings. The 1-Month Gantt Chart comes in two slide versions for different presentation styles. Both display the same monthly schedule, with five project activities arranged against a daily timeline. The preview shows how task progress and remaining work appear alongside their scheduled periods.
- 出典
- PresentationGo
- 形式
- pptx
- サイズ
- 99 KB
- ダウンロード数
- 0
作者 / 著作権:PresentationGo
元のページ:PresentationGo original