 100% 無料
6×2 Two-Level Chart for PowerPoint and Google Slides
Showcase intricate, interconnected ideas in your presentations using the 6x2 Two-Level Chart for PowerPoint and Google Slides.
テンプレートの詳細
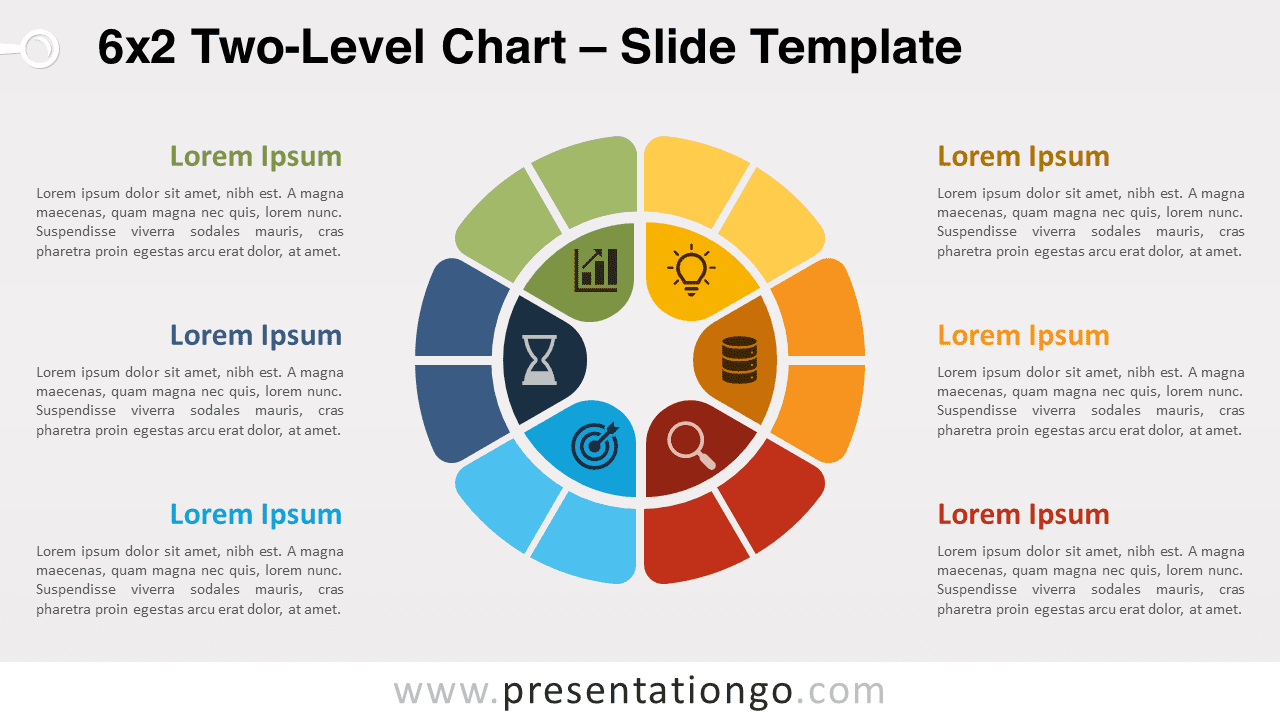
Showcase intricate, interconnected ideas in your presentations using the 5×2 Two-Level Chart for PowerPoint and Google Slides. Editable graphics with icons and text placeholders. A well-crafted slide can communicate more powerfully than an extensive discourse. And with this adaptable free template, you will be able to present intricate, related concepts while boosting your infographics. Multi-level doughnut charts use an advanced data visualization technique to portray hierarchical connections among numerous series. More specifically, the contemporary, user-friendly design of this chart ensures quick comprehension for your audience. Its circular, vibrant structure organizes information into digestible, visually engaging segments. The chart consists of an inner circle (the root node) at the center, split into six distinct sections, each accompanied by an icon to illustrate your idea or step. An outer circle encloses the inner circle, with each section of the inner circle further divided into two equal parts. These child items demonstrate their association with the parent category they belong to. Moreover, text placeholders on both sides of the chart allow you to offer detailed explanations of your ideas, thoughts, facts, or pieces of information. This helps your audience easily understand the interrelated relationships being showcased. This template is ideal for presenting linked information, hierarchies, or concepts. Download and use this essential doughnut chart to upgrade your presentations.
- 出典
- PresentationGo
- 形式
- pptx
- サイズ
- 128 KB
- ダウンロード数
- 0
- スライド枚数
- 2
- アスペクト比
- 16:9
作者 / 著作権:PresentationGo
元のページ:PresentationGo original