 100% 無料
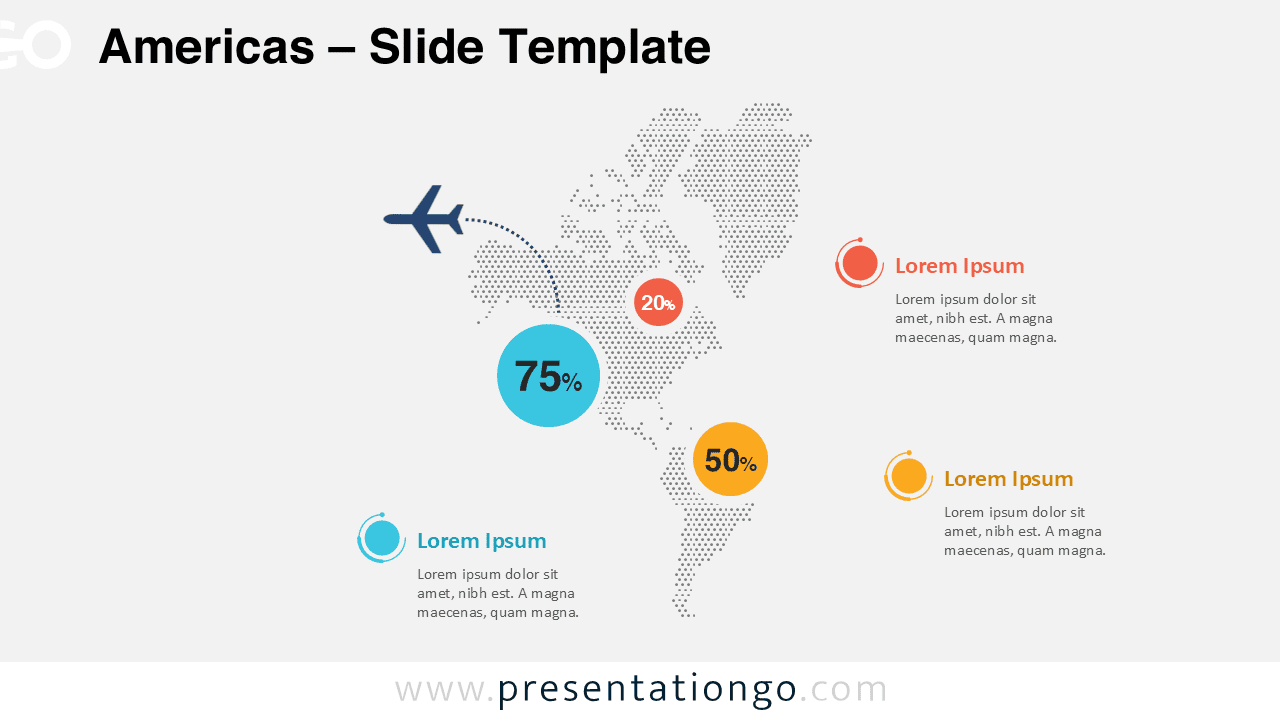
Americas Dotted Map Infographic
Highlight data across North and South America using this modern dotted map infographic designed for PowerPoint and Google Slides presentations.
テンプレートの詳細
The Americas Dotted Map Infographic provides a modern and visually engaging way to present geographic data across North America, Central America, and South America. Designed for PowerPoint and Google Slides, this infographic uses a clean dotted pattern to represent the continent while allowing presenters to highlight key regions, statistics, or strategic insights. This infographic layout is particularly useful when presenting regional performance, market expansion strategies, travel routes, or demographic information. The dotted map design keeps the slide visually light while still maintaining strong geographic recognition.
- 出典
- PresentationGo
- 形式
- pptx
- サイズ
- 240 KB
- ダウンロード数
- 0
作者 / 著作権:PresentationGo
元のページ:PresentationGo original