 100% 無料
Bowtie Diagram for PowerPoint and Google Slides
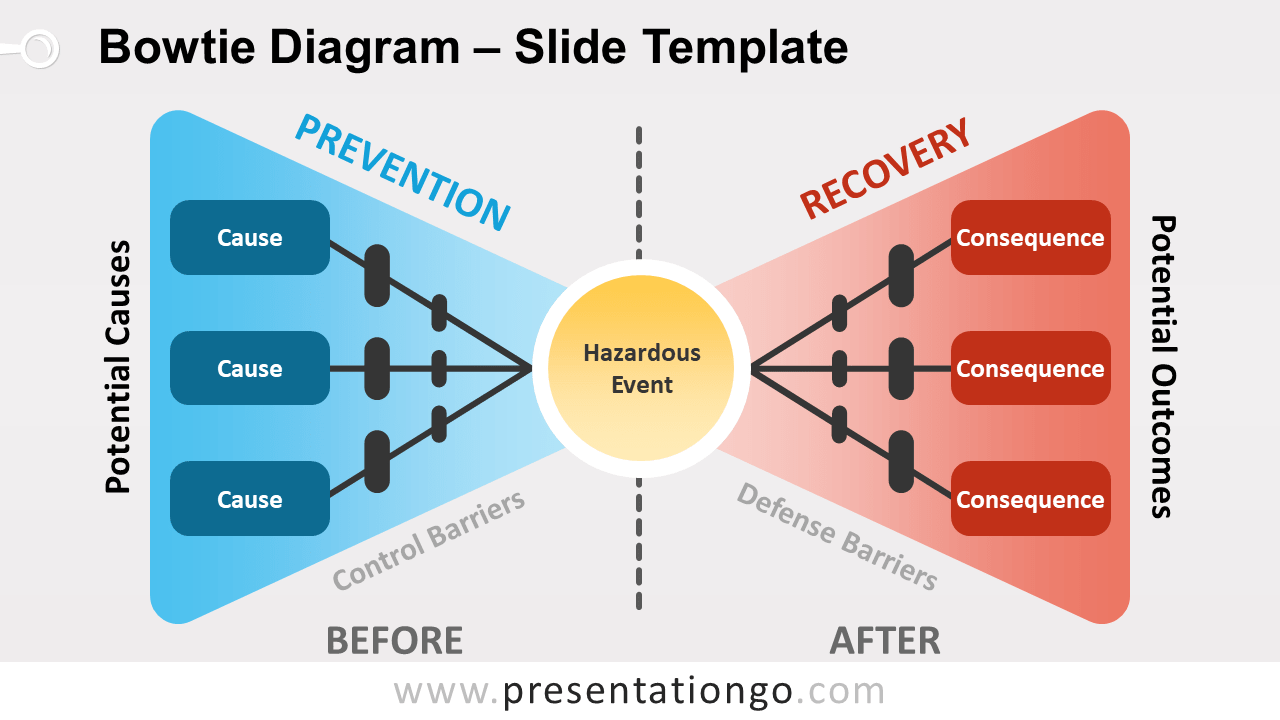
Free bowtie diagram for PowerPoint and Google Slides. A risk-assessment diagram to identify the relationships of risks, from its causes to its consequences.
テンプレートの詳細
Free bowtie diagram for PowerPoint and Google Slides. A risk-assessment diagram to identify and understand the relationships of risks, from its causes to its consequences. Editable graphics. The bowtie diagram is a risk-assessment visual concept. It has the shape of a bow tie. In general, this diagram is used for communicating and simplifying the flow of risk thinking. In other words, the bowtie method aims to analyze and to understand the pathways of risk from its causes to its consequences . More specifically, on the diagram, the causes are displayed on the left side of the bowtie. On the right side, the consequences . And, in the center of the diagram, you have the risks (refering to the main event). The left side identifies the “before” part. This is the moment when you can put in place preventive controls and response strategies. Identifying these causes helps to minimize the consequences (“after”), and then stop the risks.
- 出典
- PresentationGo
- 形式
- pptx
- サイズ
- 78 KB
- ダウンロード数
- 0
- スライド枚数
- 2
- アスペクト比
- 16:9
作者 / 著作権:PresentationGo
元のページ:PresentationGo original