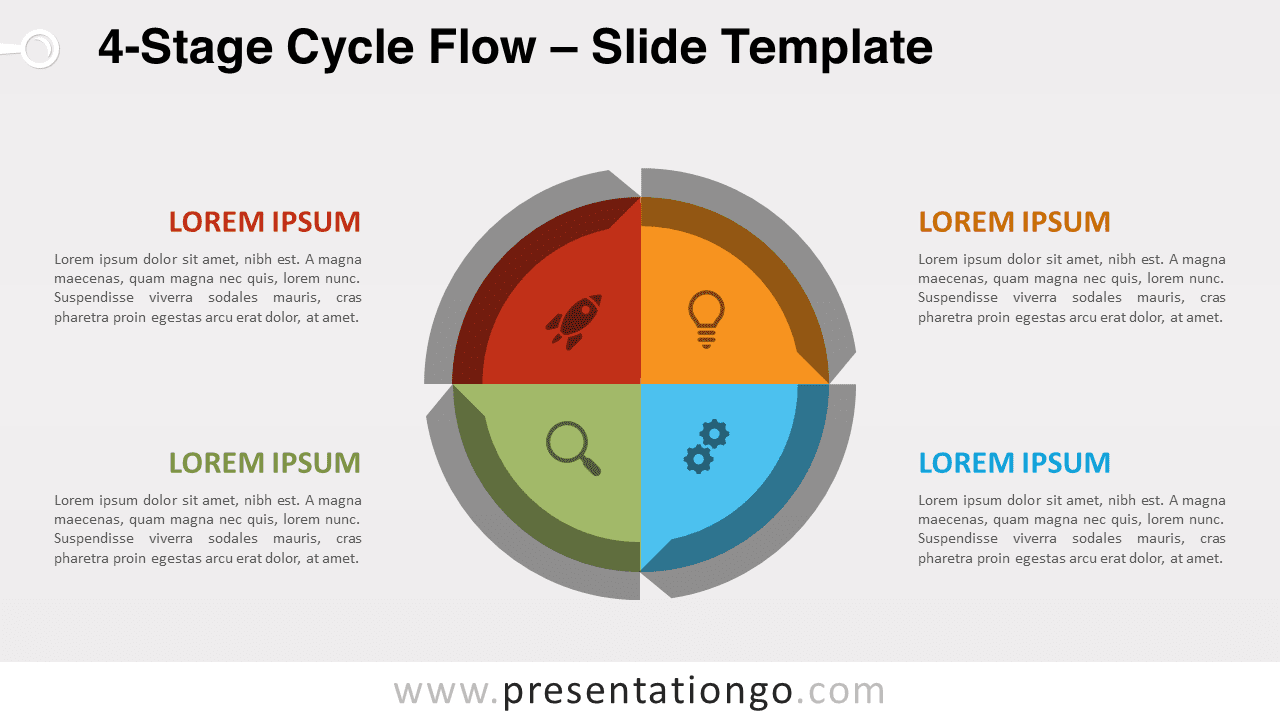
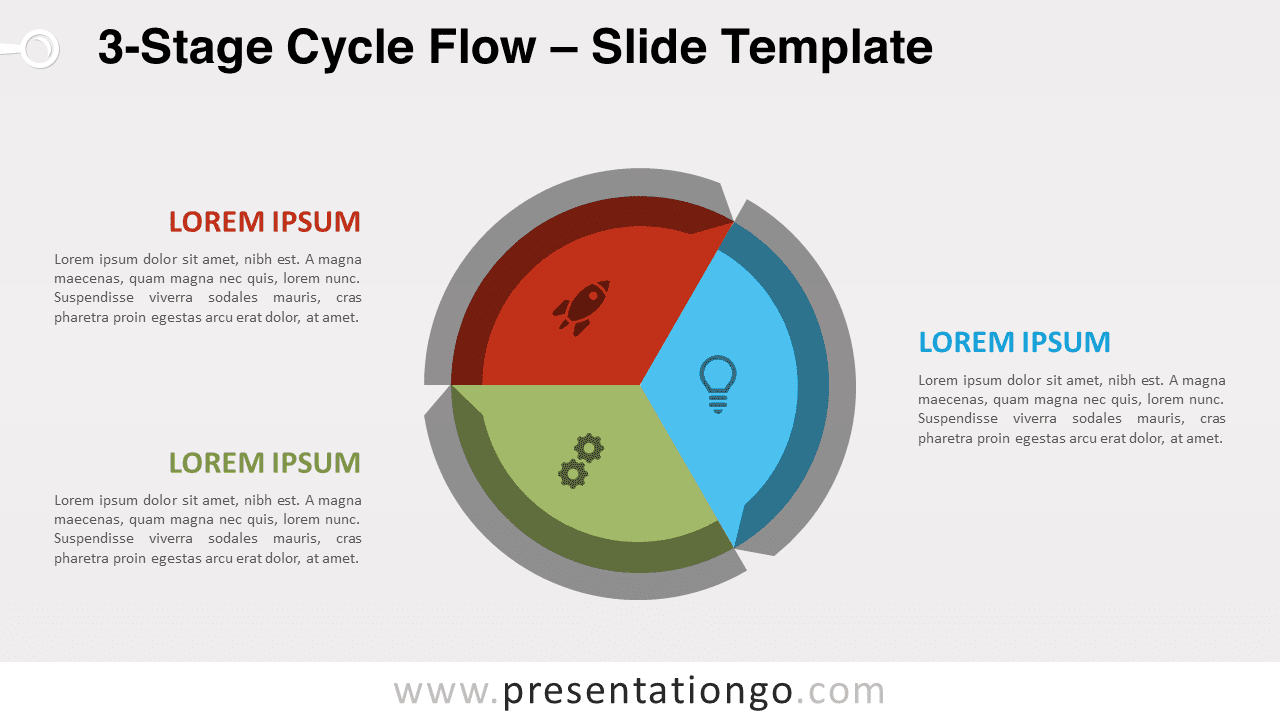
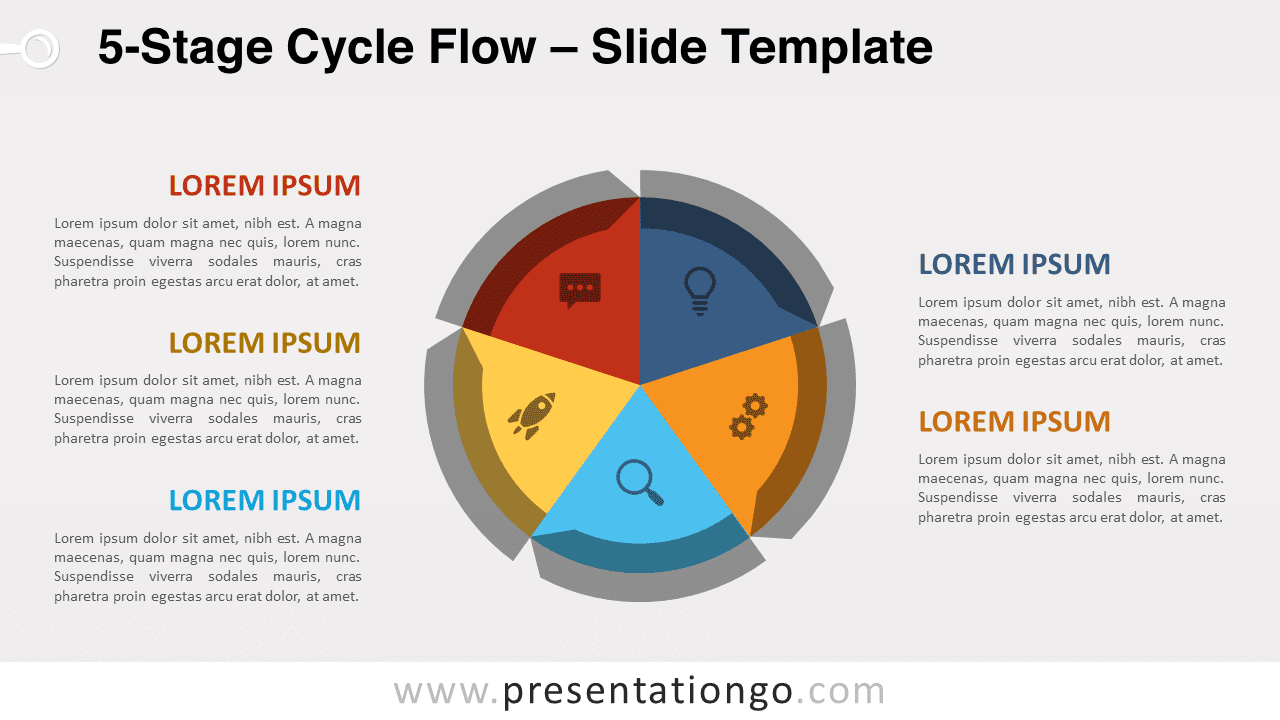
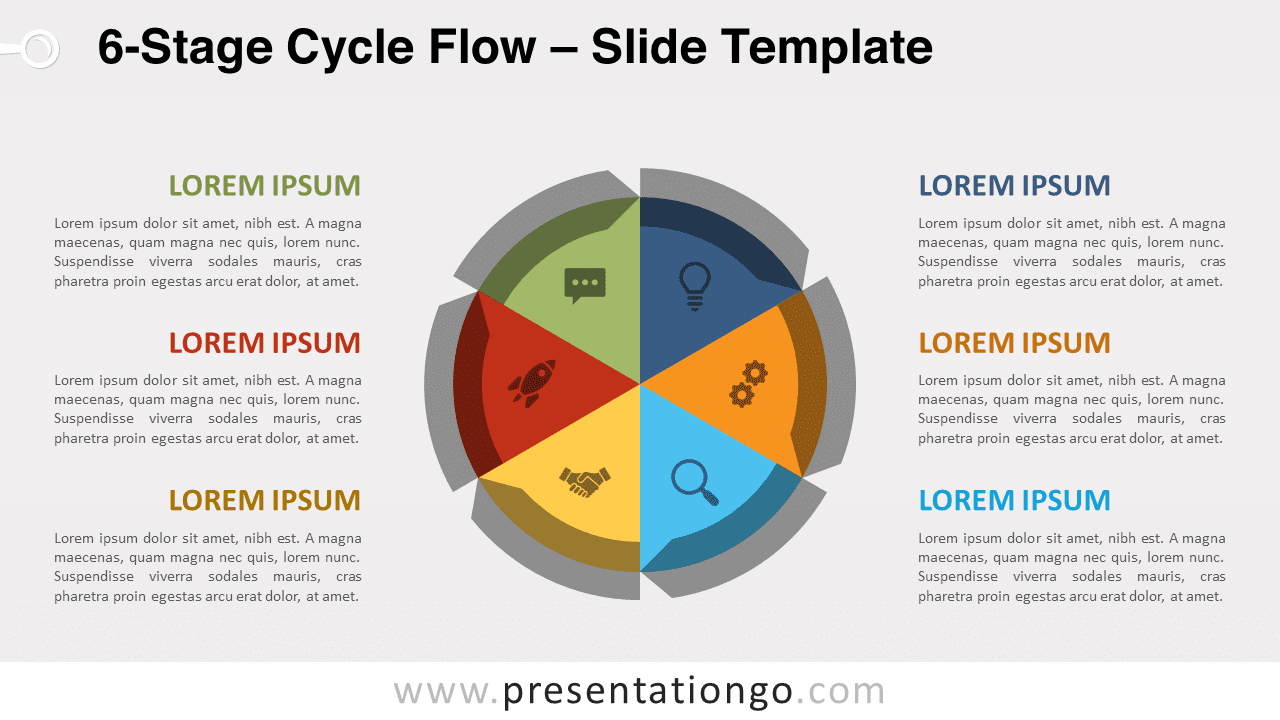
 100% 無料
Can Chart for PowerPoint
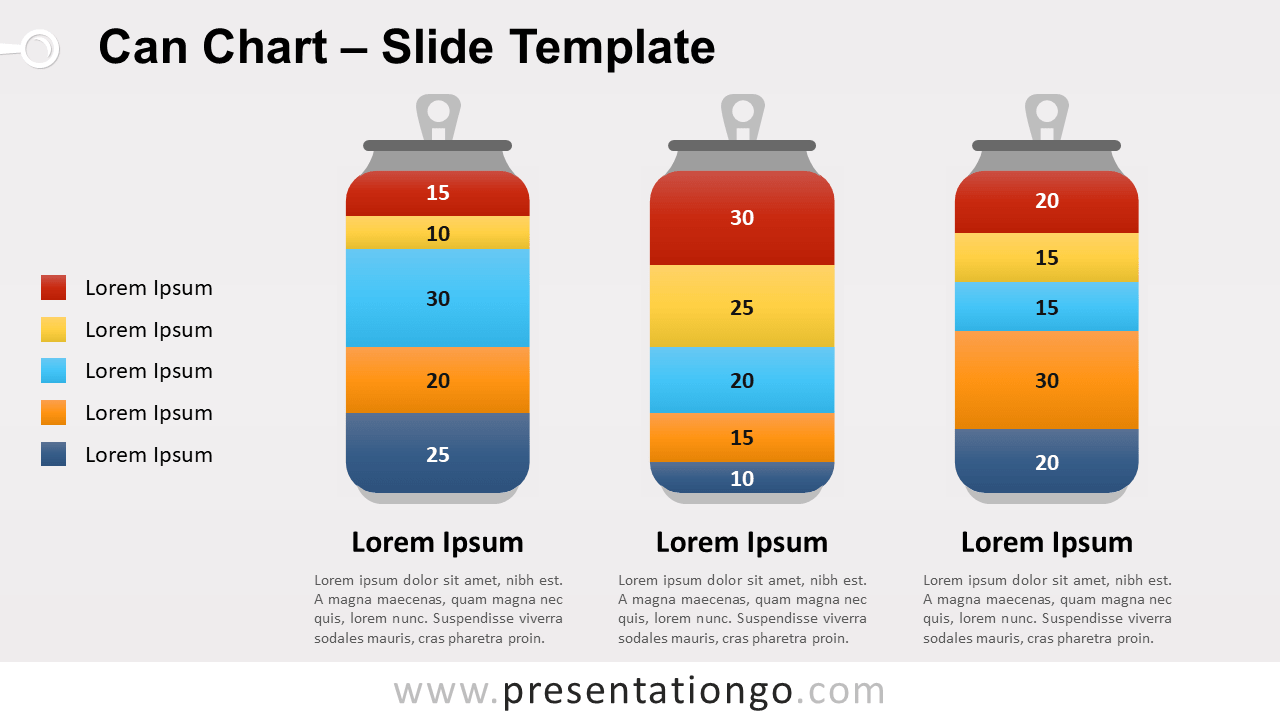
Free can chart for PowerPoint. Pictorial visualization of 3 can shapes filled with a stacked column graph. Data visualization made with data-driven charts.
テンプレートの詳細
Free can chart for PowerPoint. Pictorial visualization of 3 can shapes filled with a 100% stacked column graph. Editable graphics with text placeholders. This creative data visualization template will make your data easier for your audience to understand. Use this pictorial stacked percentage chart in your presentation to compare quantitative results or to illustrate data about food, drinks, or more specifically about beer or soda.
- 出典
- PresentationGo
- 形式
- pptx
- サイズ
- 160 KB
- ダウンロード数
- 0
- スライド枚数
- 2
- アスペクト比
- 16:9
タグ
作者 / 著作権:PresentationGo
元のページ:PresentationGo original