 100% 無料
Cocktail Chart for PowerPoint and Google Slides
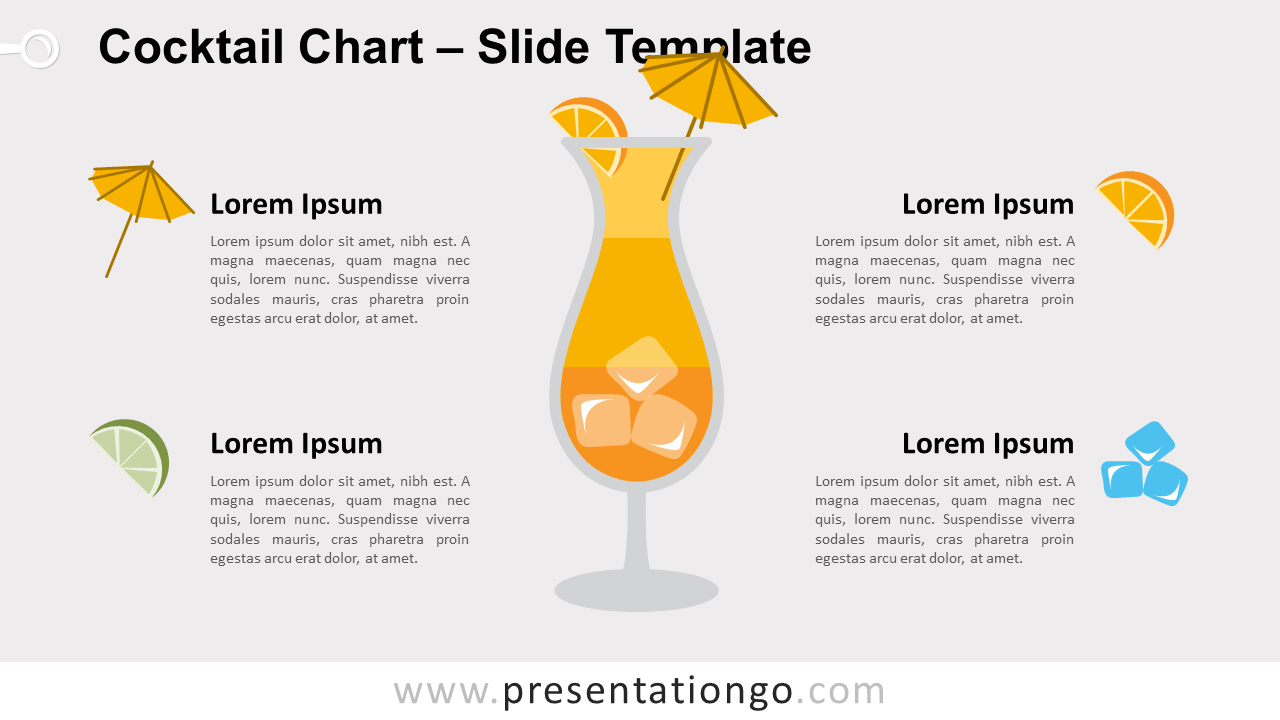
Free cocktail chart for PowerPoint and Google Slides. A cocktail glass with data-driven column chart. Creative chart to show quantitative results.
テンプレートの詳細
Free cocktail chart for PowerPoint and Google Slides. Illustration of a cocktail glass with a data-driven column chart. Editable graphics with text placeholders. This graphic with data shows a hurricane cocktail glass with ice, an umbrella toothpick, and an orange slice. You can use this creative chart in your presentation to illustrate quantitative results . In particular, this chart will be perfect for any topics related to holidays, celebrations, parties or Summer. Built-in data driven PowerPoint chart: made with 100% stacked column chart, you can easily change data series and format (e.g., colors). First step – Select and customize the color of the glass shape to fit your slide’s background
- 出典
- PresentationGo
- 形式
- pptx
- サイズ
- 113 KB
- ダウンロード数
- 0
- スライド枚数
- 2
- アスペクト比
- 16:9
作者 / 著作権:PresentationGo
元のページ:PresentationGo original