 100% 無料
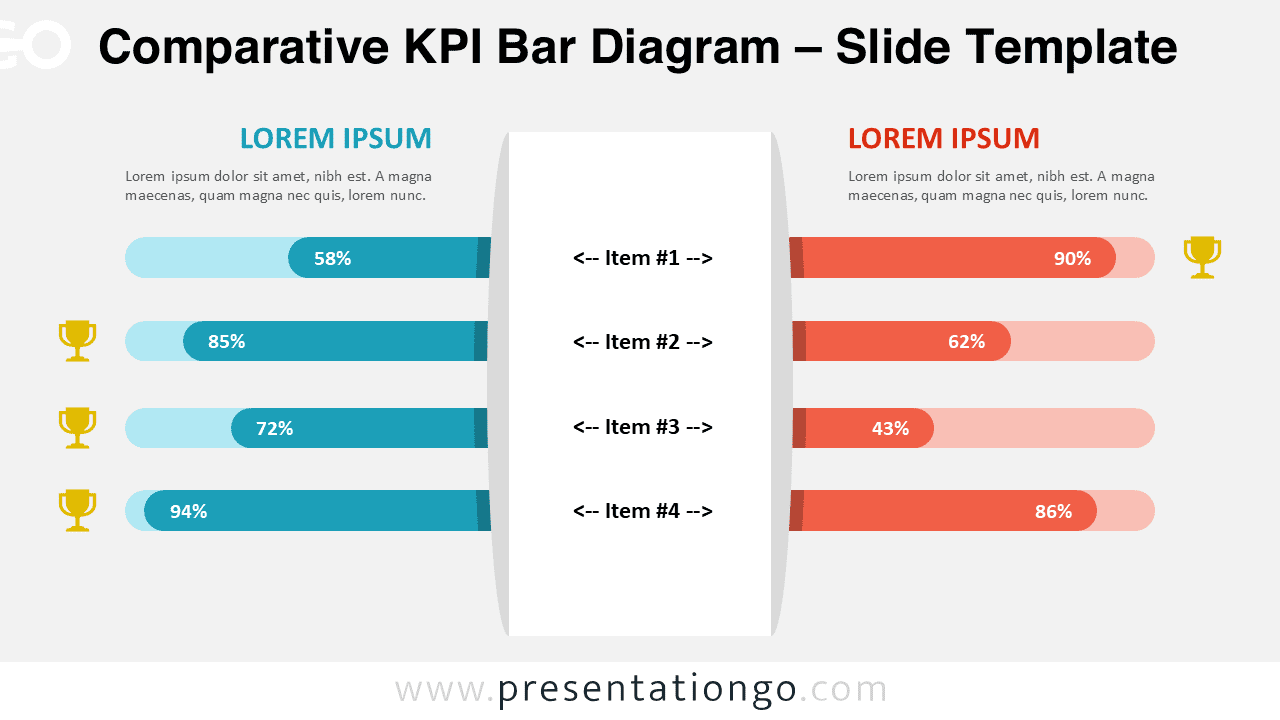
Comparative KPI Bar Diagram
Compare KPIs visually with this dual bar diagram for PowerPoint and Google Slides. Editable infographic to to present side-by-side metrics.
テンプレートの詳細
The Comparative KPI Bar Diagram is a practical visual tool designed to present performance metrics side by side. It helps audiences quickly compare values, results, or benchmarks between two entities. This diagram works well for business reports, performance reviews, and analytical presentations. Its clean layout and balanced structure support clear data storytelling without visual overload.
- 出典
- PresentationGo
- 形式
- pptx
- サイズ
- 100 KB
- ダウンロード数
- 0
作者 / 著作権:PresentationGo
元のページ:PresentationGo original