 100% 無料
Cycle Matrix Pie Chart for PowerPoint
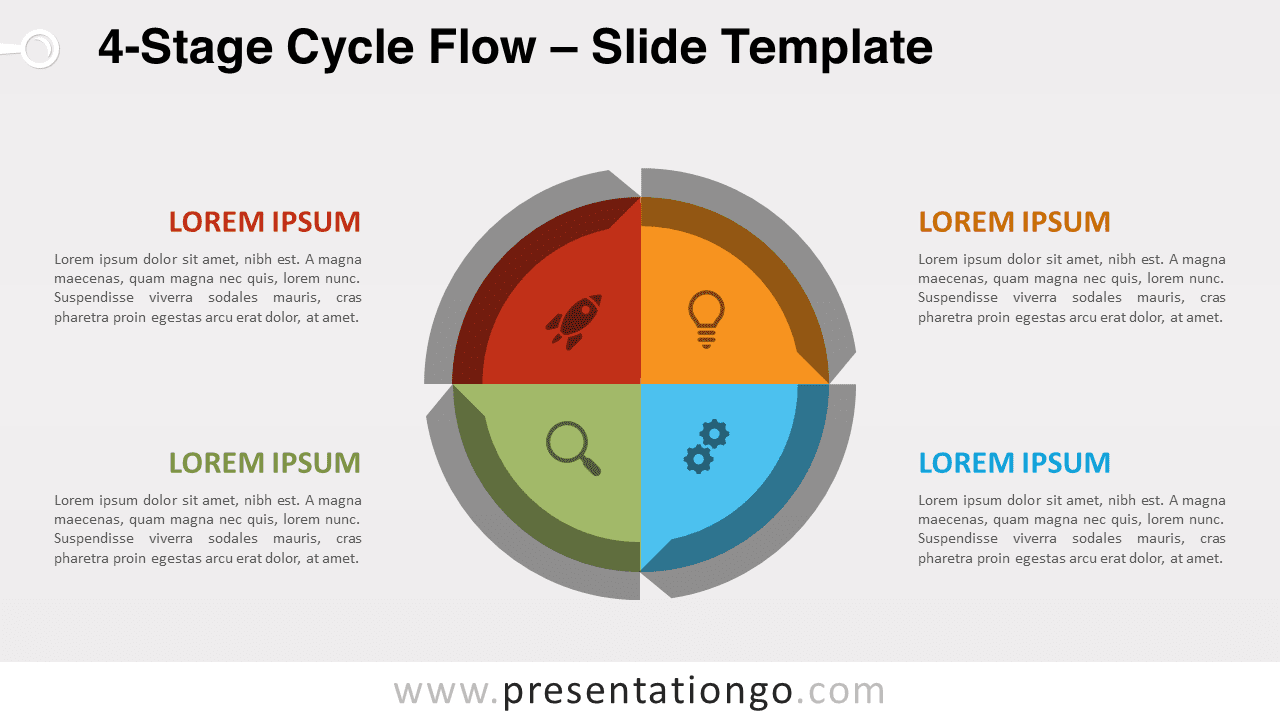
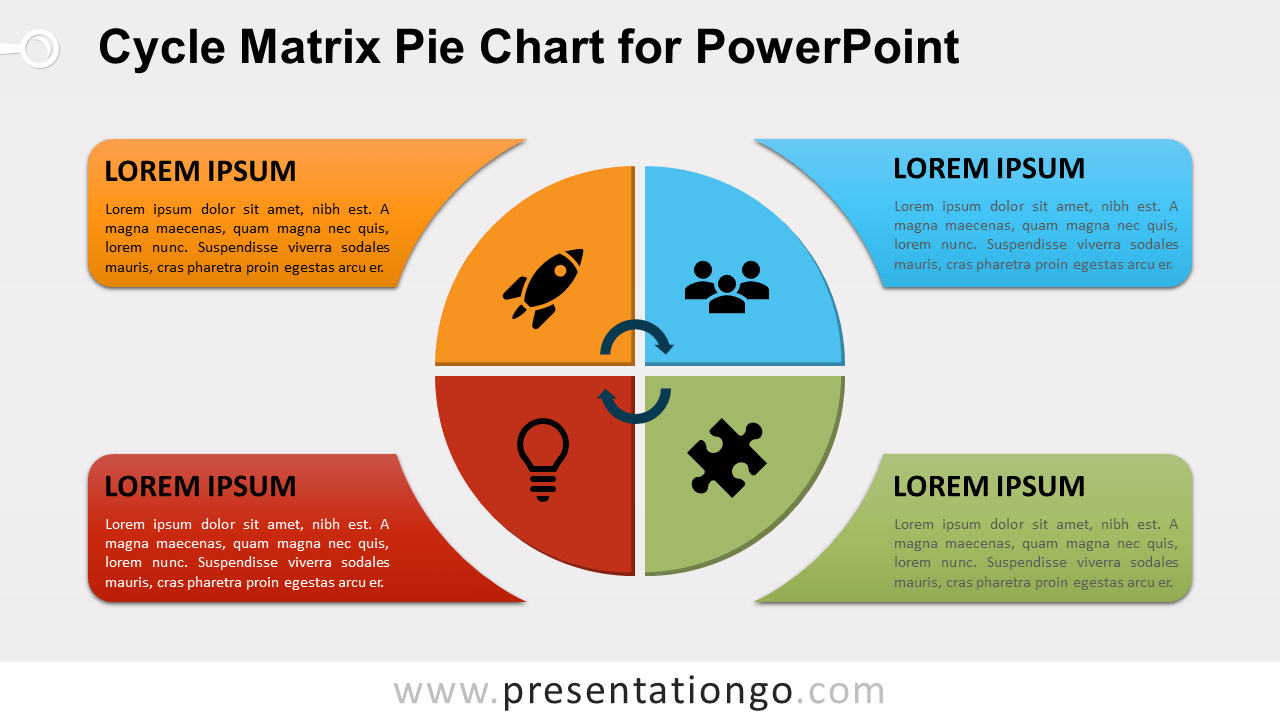
Free cycle matrix pie chart for PowerPoint. Non-data-driven chart with 4 pies or wedges, and text shapes to the side of each pie shape. Editable graphics with icon and text placeholders.
テンプレートの詳細
Free cycle matrix pie chart for PowerPoint. Non-data-driven chart with 4 pies or wedges, and text shapes to the side of each pie shape. Editable graphics with icon and text placeholders. The 2×2 matrix is commonly used in business strategy as a representational tool to show conflicting concepts and for decision making. This four-quadrant matrix diagram is perfect to be used for business or marketing matrices like BCG, SWOT, Ansoff, risk assessment…
- 出典
- PresentationGo
- 形式
- pptx
- サイズ
- 109 KB
- ダウンロード数
- 0
- スライド枚数
- 2
- アスペクト比
- 16:9
作者 / 著作権:PresentationGo
元のページ:PresentationGo original