 100% 無料
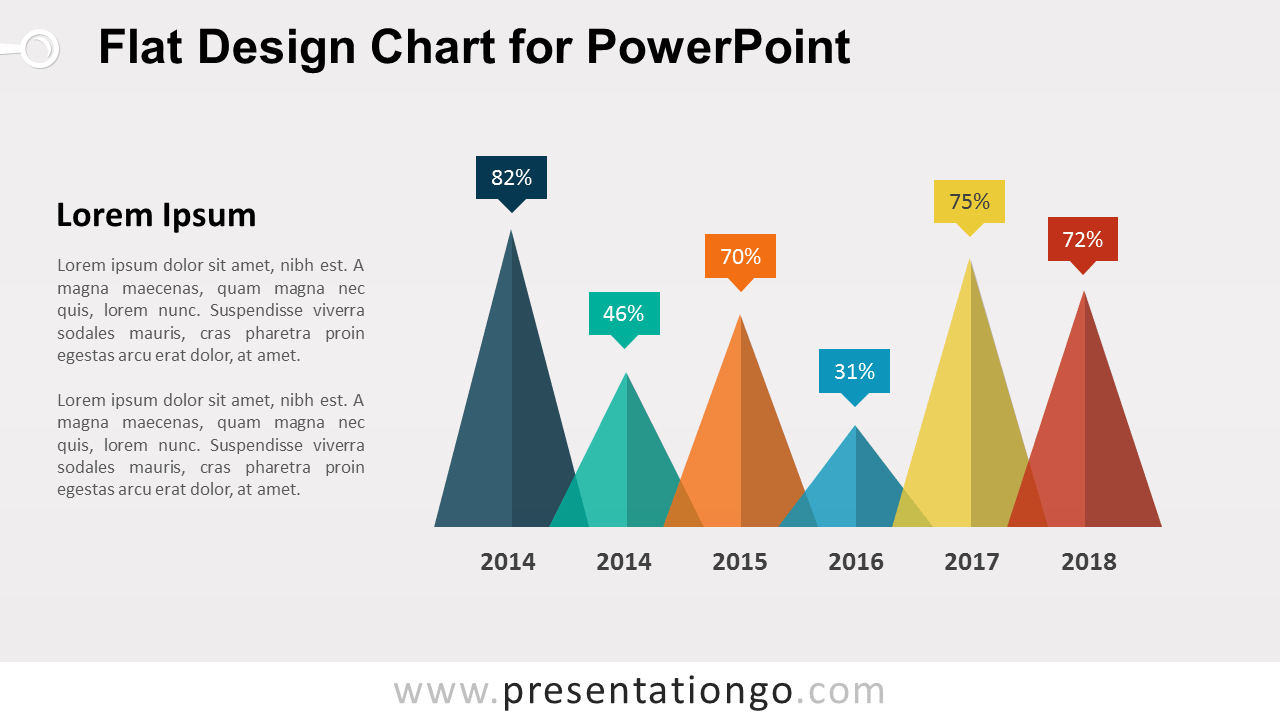
Flat Design Triangle Chart
Download the Flat Design Triangle Chart for PowerPoint with six editable triangular data points for percentages, KPIs, trends, and performance comparisons.
テンプレートの詳細
The Flat Design Triangle Chart for PowerPoint compares six quantitative values through overlapping triangular shapes. Each triangle pairs with a percentage callout and category label, while the text area provides room for context or analysis. Use the layout for KPIs, performance results, survey findings, trends, or other six-point comparisons.
- 出典
- PresentationGo
- 形式
- pptx
- サイズ
- 67 KB
- ダウンロード数
- 0
タグ
作者 / 著作権:PresentationGo
元のページ:PresentationGo original