 100% 無料
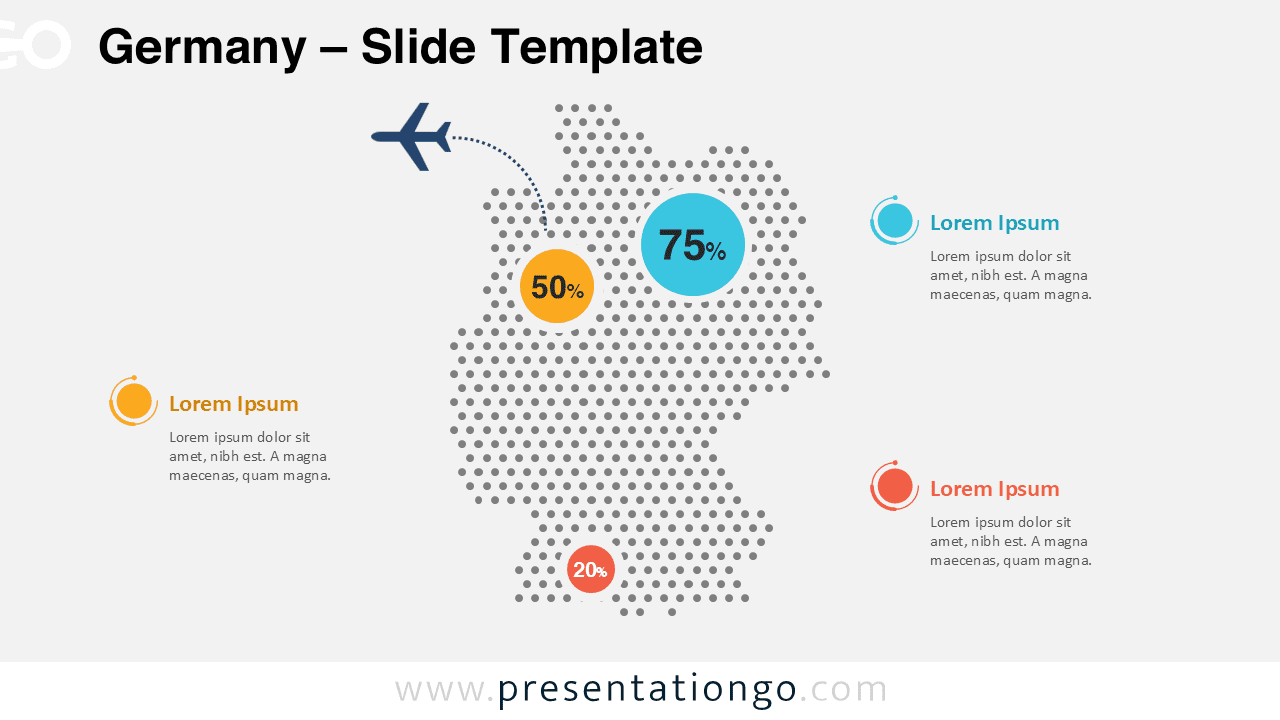
Germany Dotted Map Infographic
Download this Germany dotted map infographic for PowerPoint and Google Slides. Highlight regional data, statistics, and business insights with editable markers.
テンプレートの詳細
The Germany Dotted Map Infographic provides a clear and modern way to present geographic data in PowerPoint and Google Slides presentations. Built using a dotted pattern that forms the recognizable shape of Germany, this infographic helps you highlight regional insights, statistics, and business information with visual clarity. Instead of displaying data through traditional charts alone, this infographic allows you to anchor information directly on the map. Percentage markers and explanatory text blocks make it easy to emphasize key locations and regional differences. As a result, audiences quickly understand geographic patterns and data distribution.
- 出典
- PresentationGo
- 形式
- pptx
- サイズ
- 146 KB
- ダウンロード数
- 0
作者 / 著作権:PresentationGo
元のページ:PresentationGo original