 100% 無料
Infographic Cluster for PowerPoint and Google Slides
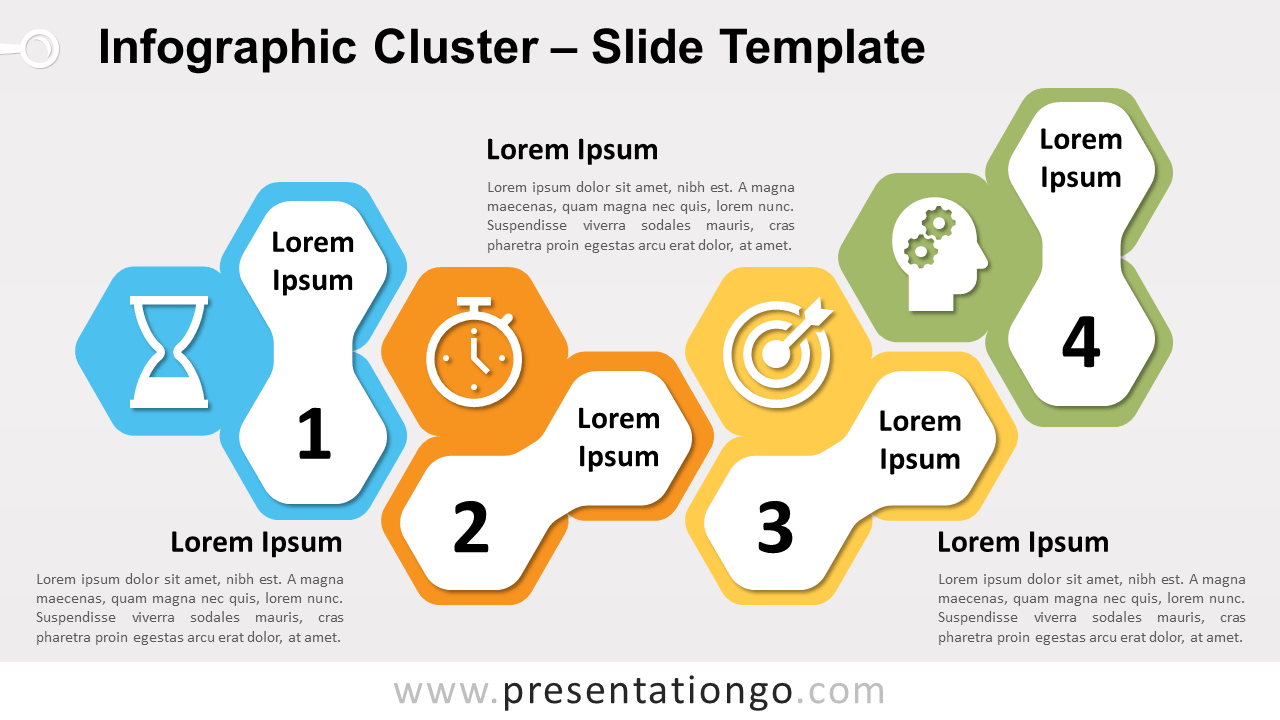
Free infographic cluster diagram for PowerPoint and Google Slides. Four elements designed with hexagons. Editable graphics with numbers, icons, and text.
テンプレートの詳細
Free infographic cluster diagram for PowerPoint and Google Slides. Four elements designed with hexagons. Editable graphics with numbers, icons, and text placeholders. Use this infographic cluster diagram in your presentations to represent a progression or four sequential steps in a task, process, or workflow. You can also use it to show how 4 individual and interconnected parts form a whole or to illustrate 4 ideas, concepts, or groups of information.
- 出典
- PresentationGo
- 形式
- pptx
- サイズ
- 95 KB
- ダウンロード数
- 0
- スライド枚数
- 2
- アスペクト比
- 16:9
作者 / 著作権:PresentationGo
元のページ:PresentationGo original