 100% 無料
Ishikawa Fishbone Diagram for PowerPoint and Google Slides
Free Ishikawa fishbone diagram for PowerPoint and Google Slides. A visual metaphor for cause and effect analysis. Editable graphics.
テンプレートの詳細
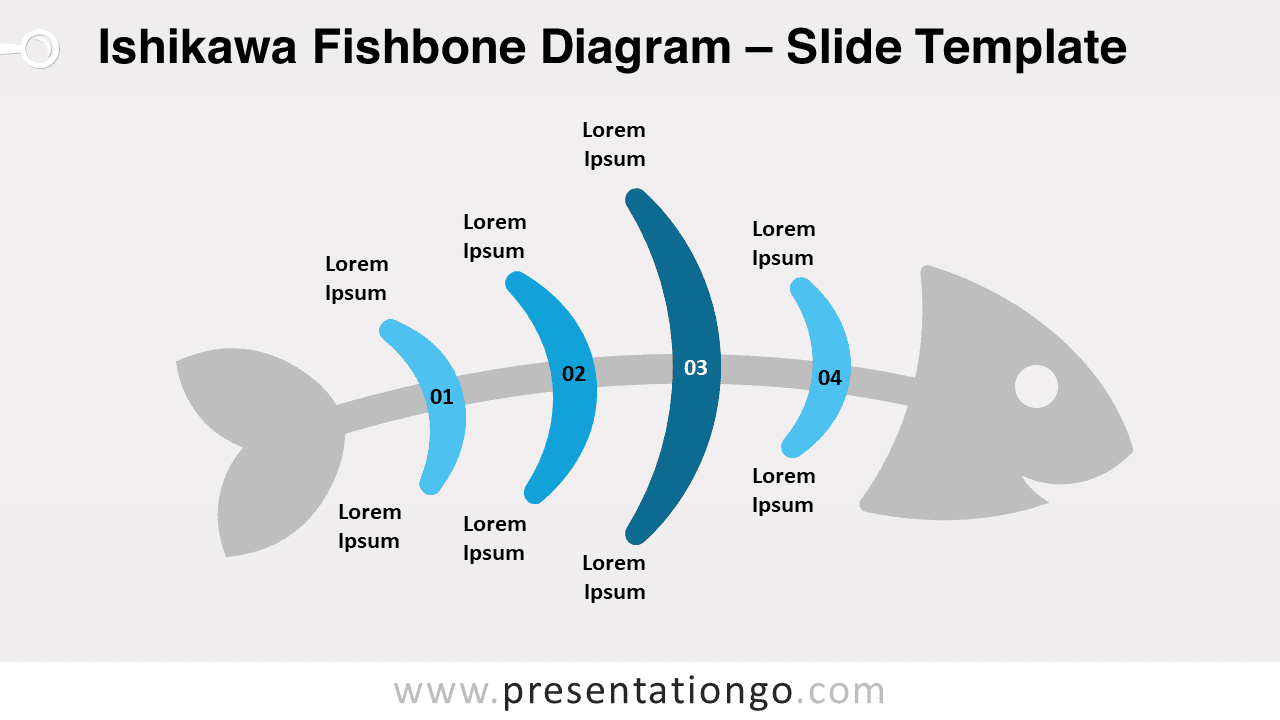
Free Ishikawa fishbone diagram for PowerPoint and Google Slides. A visual metaphor for cause and effect analysis. Editable graphics with numbers, icons, and text placeholders. Time to modernize your Ishikawa diagrams with a great design! If you want to show the different potential causes of an event, then download this free Ishikawa Fishbone Diagram template! This slide shows a large fishbone with a gray head, vertebral column, and head. The fish skeleton is completed by 4 vertebral arches aligned in a horizontal way. These will represent your 4 or 8 options to illustrate the 4 or 8 causes that will lead to a consequence. You can indeed write a figure from 1 to 4 on each bone to number your causes. Finally, you can name your 4 or 8 causes, reasons or origins with text placeholders you can find at the end of each rib. Ishikawa diagrams are classics of business presentations since they show the causes of a process and event. Indeed, this free Ishikawa Fishbone Diagram template is a great tool to show the evolution that can lead either to failure or success!
- 出典
- PresentationGo
- 形式
- pptx
- サイズ
- 68 KB
- ダウンロード数
- 0
- スライド枚数
- 2
- アスペクト比
- 16:9
作者 / 著作権:PresentationGo
元のページ:PresentationGo original