 100% 無料
Lab Beaker Chart for PowerPoint and Google Slides
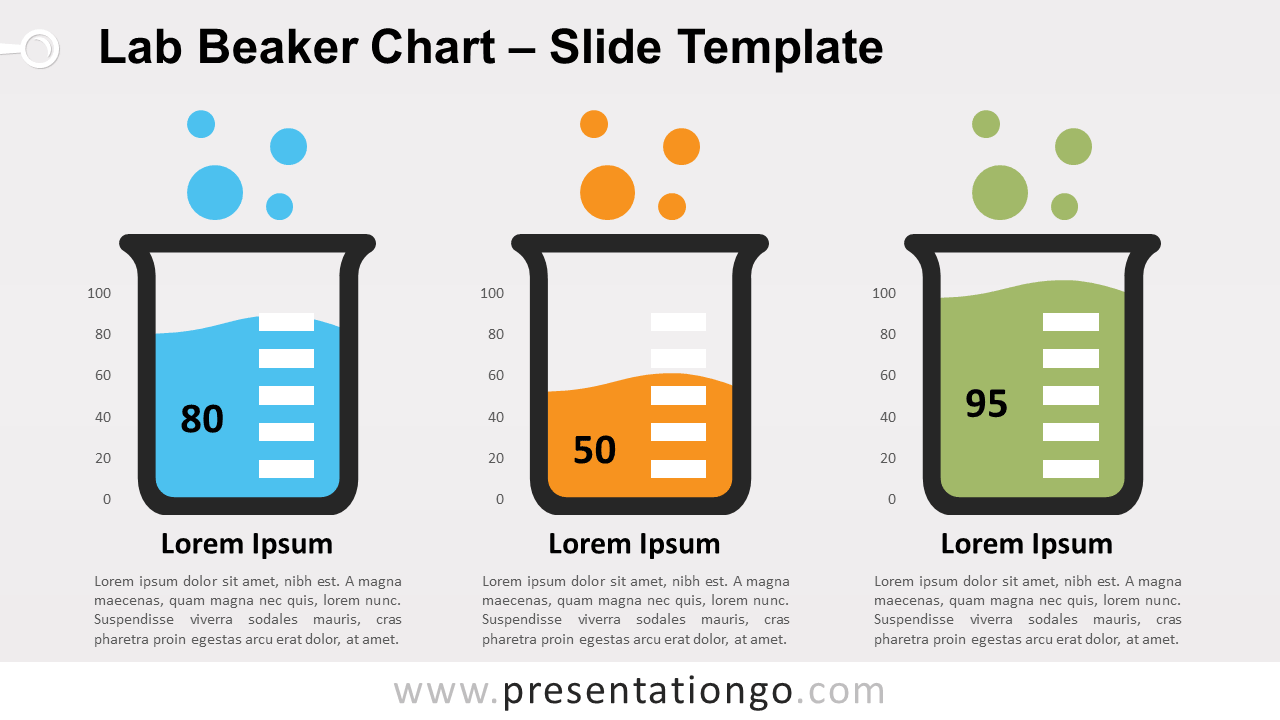
Free lab beaker chart for PowerPoint and Google Slides. 3 laboratory graduated beaker graphics with a 0-100 scale. Data-driven chart for PPTX.
テンプレートの詳細
Free lab beaker chart for PowerPoint and Google Slides. Three (3) laboratory graduated beaker graphics with a 0-100 scale. Editable graphics with numbers and text placeholders. Use this infographic chart in your presentation to compare quantitative results . These charts will be perfect for any topics related to chemistry, science, medicine, pharmacy. Built-in data driven PowerPoint chart: made with column chart, you can easily change data series and format (e.g., colors).
- 出典
- PresentationGo
- 形式
- pptx
- サイズ
- 169 KB
- ダウンロード数
- 0
- スライド枚数
- 2
- アスペクト比
- 16:9
タグ
作者 / 著作権:PresentationGo
元のページ:PresentationGo original