 100% 無料
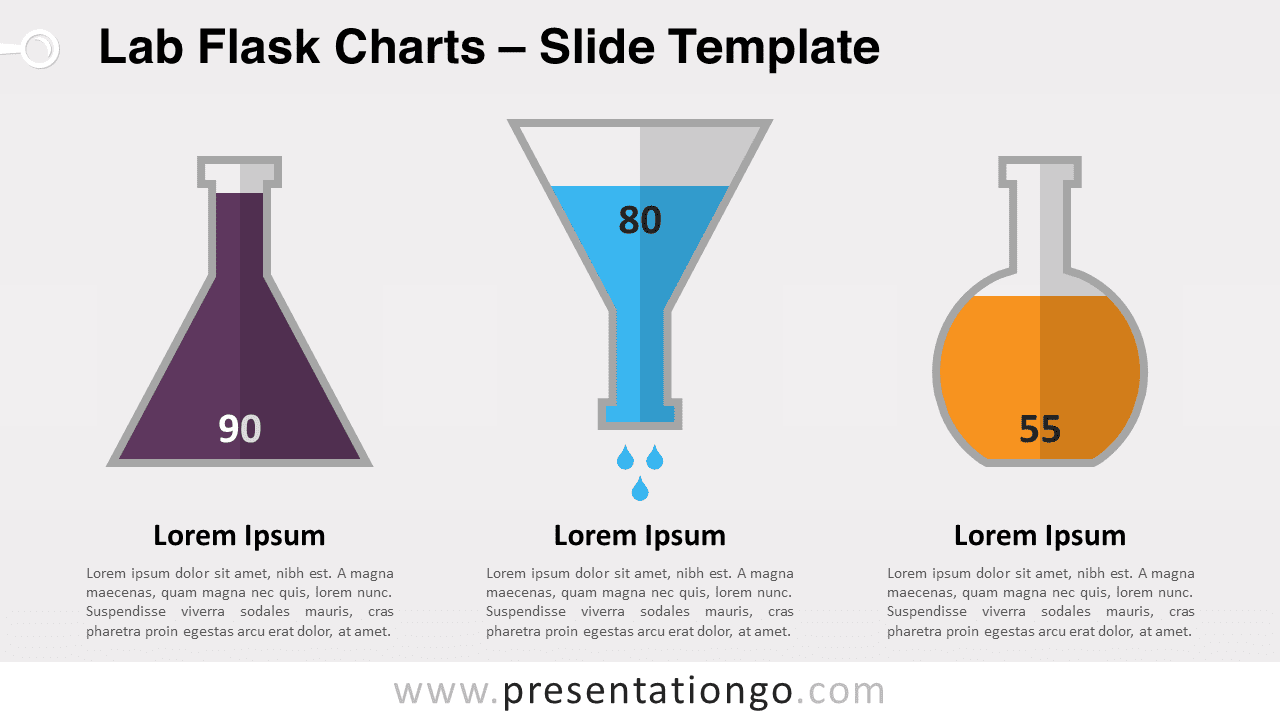
Lab Flask Charts for PowerPoint and Google Slides
Enhance science presentations with data visualization using Lab Flask Charts for PowerPoint and Google Slides. Dynamic, editable graphics.
テンプレートの詳細
Unveil a new dimension of data storytelling with our Lab Flask Charts for PowerPoint and Google Slides – a sleek, purpose-driven design that transforms figures into visual narratives. Ideal for educators and analysts, this template turns data into captivating, easy-to-understand visual charts. In the realm of presentations, data visualization is not just a benefit; it’s a necessity. It converts rows of data into a clear visual context, making insights more accessible and memorable. Imagine lab flasks, not just as containers but as dynamic data charts that shift with your story, providing a snapshot of information at a glance. This creative embodiment of data engages the audience, enhancing both comprehension and retention. Whether you’re illustrating chemical reactions for a science class or showcasing quarterly financial results, our lab flask charts provide an innovative twist. For educators, it’s a gateway to a more interactive learning experience. For business professionals, it’s a tool to present data trends and forecasts with a novel visual hook. These charts are particularly effective when depicting growth measurements, comparative analyses, or any data that benefits from a clear, vertical scale representation. In conclusion, the Lab Flask Charts template is a powerful ally for any presenter aiming to make an impact. It’s not just about showing data; it’s about telling a story that sticks. With its editable features and dual-layout compatibility, it’s a versatile asset designed to elevate your presentation and engage your audience. Embrace the art of data with this unique, insightful template.
- 出典
- PresentationGo
- 形式
- pptx
- サイズ
- 144 KB
- ダウンロード数
- 0
- スライド枚数
- 2
- アスペクト比
- 16:9
作者 / 著作権:PresentationGo
元のページ:PresentationGo original