 100% 無料
Light Bulb Chart for PowerPoint
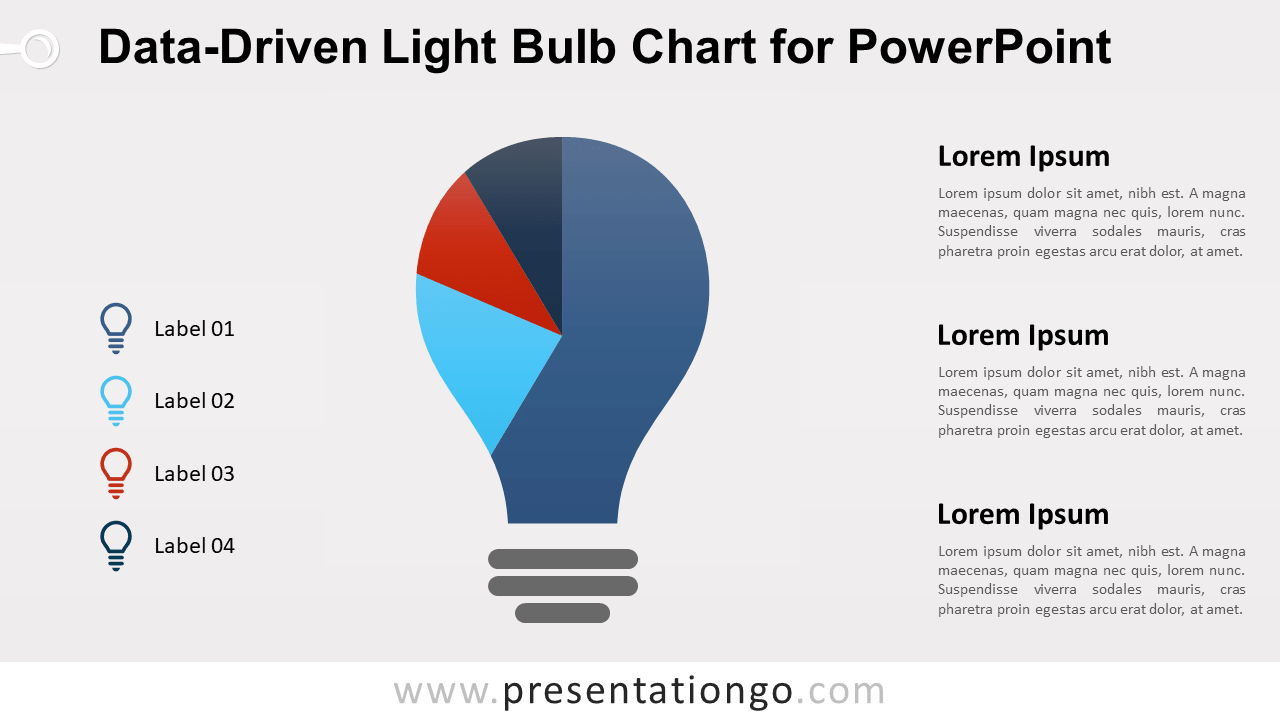
Free light bulb chart for PowerPoint. Bulb design made with a data-driven pie chart. Infographic metaphor for ideas, innovation. 100% editable graphics.
テンプレートの詳細
Free light bulb chart for PowerPoint. Bulb design made with a data-driven pie chart. Editable graphics with text placeholder. Use this creative chart in your presentation for quantitative results about (bright) ideas , innovations, or about electricity, for example. Built-in data driven PowerPoint chart: you can easily change data series and format (e.g., colors). Click on the shape to change the background color – to fit yours. Then, just right-click the chart to edit the data series ( Edit Data ):
- 出典
- PresentationGo
- 形式
- pptx
- サイズ
- 164 KB
- ダウンロード数
- 0
- スライド枚数
- 2
- アスペクト比
- 16:9
作者 / 著作権:PresentationGo
元のページ:PresentationGo original