 100% 無料
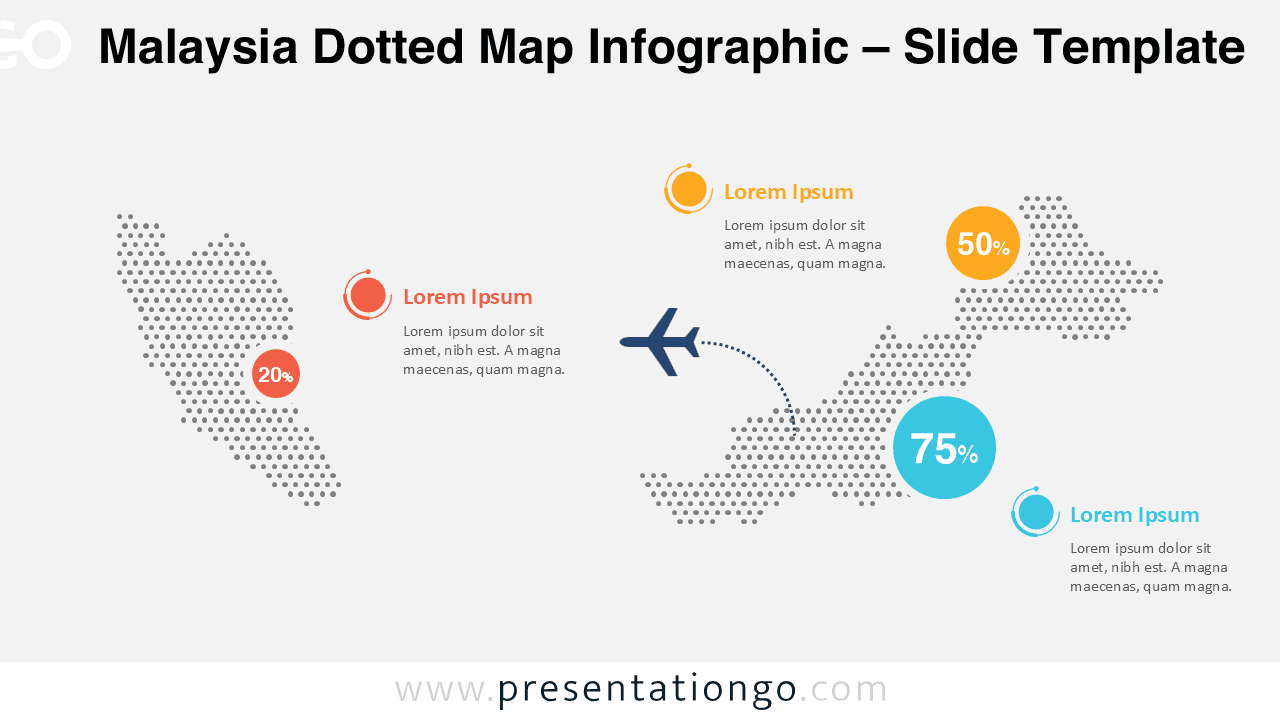
Malaysia Dotted Map Infographic
Visualize regional statistics with a Malaysia dotted map infographic. Fully editable, scalable, and compatible with PowerPoint and Google Slides.
テンプレートの詳細
The Malaysia Dotted Map Infographic is a clean and professional visual solution designed to present country-level data with clarity and impact. Built for PowerPoint and Google Slides, this infographic helps transform complex regional information into an easy-to-understand geographic representation. Using a modern dotted map style, the layout highlights both Peninsular Malaysia and East Malaysia while maintaining strong visual balance. The minimalist design ensures your data remains the focal point, making it suitable for business, education, and institutional presentations.
- 出典
- PresentationGo
- 形式
- pptx
- サイズ
- 181 KB
- ダウンロード数
- 0
作者 / 著作権:PresentationGo
元のページ:PresentationGo original