 100% 無料
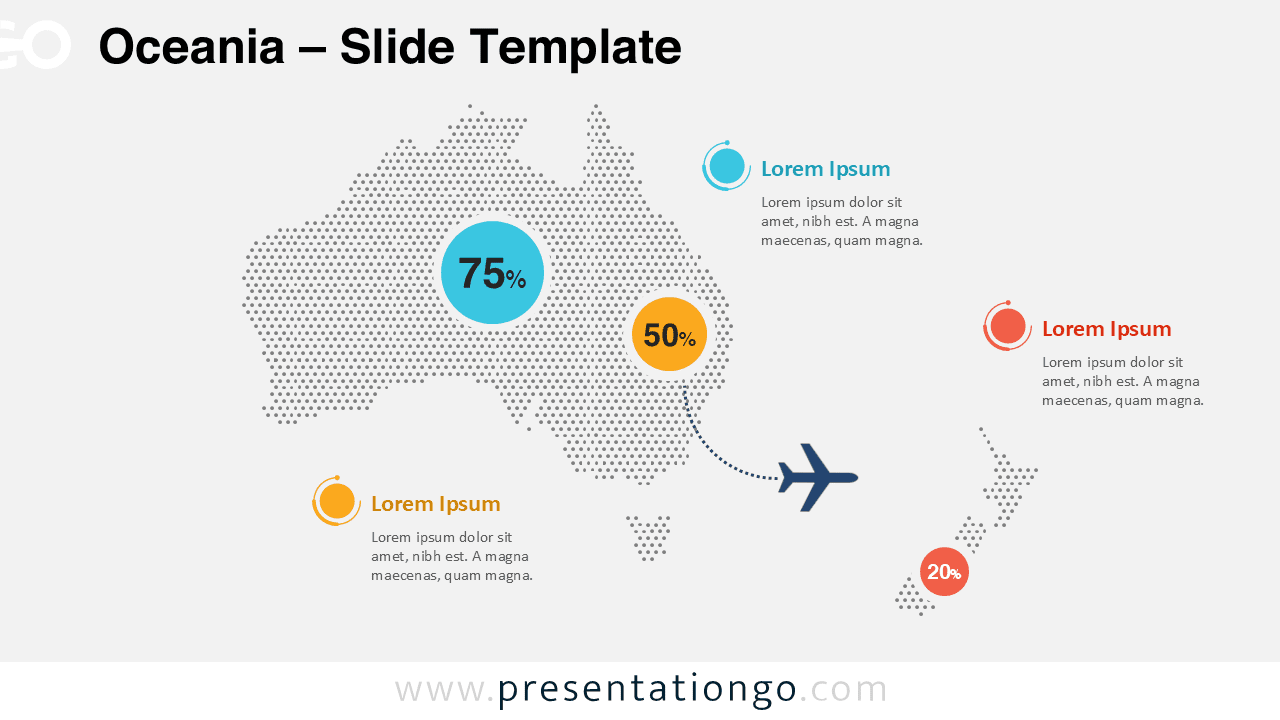
Oceania Dotted Map Infographic
Download the free Oceania dotted map infographic for PowerPoint and Google Slides. Edit colors, data points, and labels for regional presentations today.
テンプレートの詳細
The Oceania Dotted Map Infographic gives you a clear way to present regional information in PowerPoint and Google Slides. It highlights Australia and New Zealand with a dotted layout, bold percentage circles, and clean text callouts. You can use it to explain statistics, market presence, travel routes, tourism flows, or geographic comparisons. The design stays simple, modern, and easy to read on different presentation themes.
- 出典
- PresentationGo
- 形式
- pptx
- サイズ
- 281 KB
- ダウンロード数
- 0
作者 / 著作権:PresentationGo
元のページ:PresentationGo original