 100% 無料
Pie Chart Hierarchy for PowerPoint
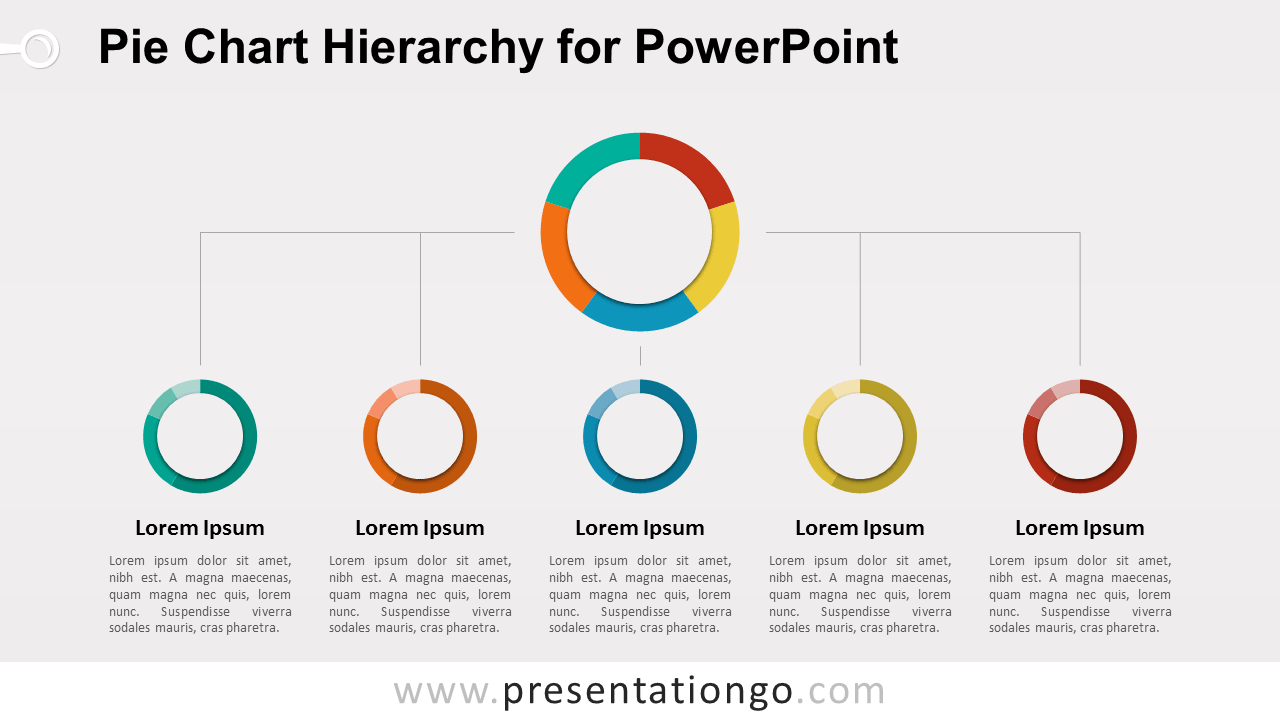
Free vertical hierarchy diagram for PowerPoint with data-driven pie-charts. Shows hierarchical relationships between various (quantitative) information.
テンプレートの詳細
Free vertical hierarchy diagram for PowerPoint with pie-charts. Vertical tree with 1 top node (level 1) and the second level with 5 pie-charts. Editable graphics with text placeholder. Made with PowerPoint data-driven pie charts : you can easily edit and change data series and format. Use this template to show hierarchical relationships between (quantitative) information or data.
- 出典
- PresentationGo
- 形式
- pptx
- サイズ
- 210 KB
- ダウンロード数
- 0
- スライド枚数
- 2
- アスペクト比
- 16:9
作者 / 著作権:PresentationGo
元のページ:PresentationGo original