 100% 無料
Progress Pie Charts for PowerPoint and Google Slides
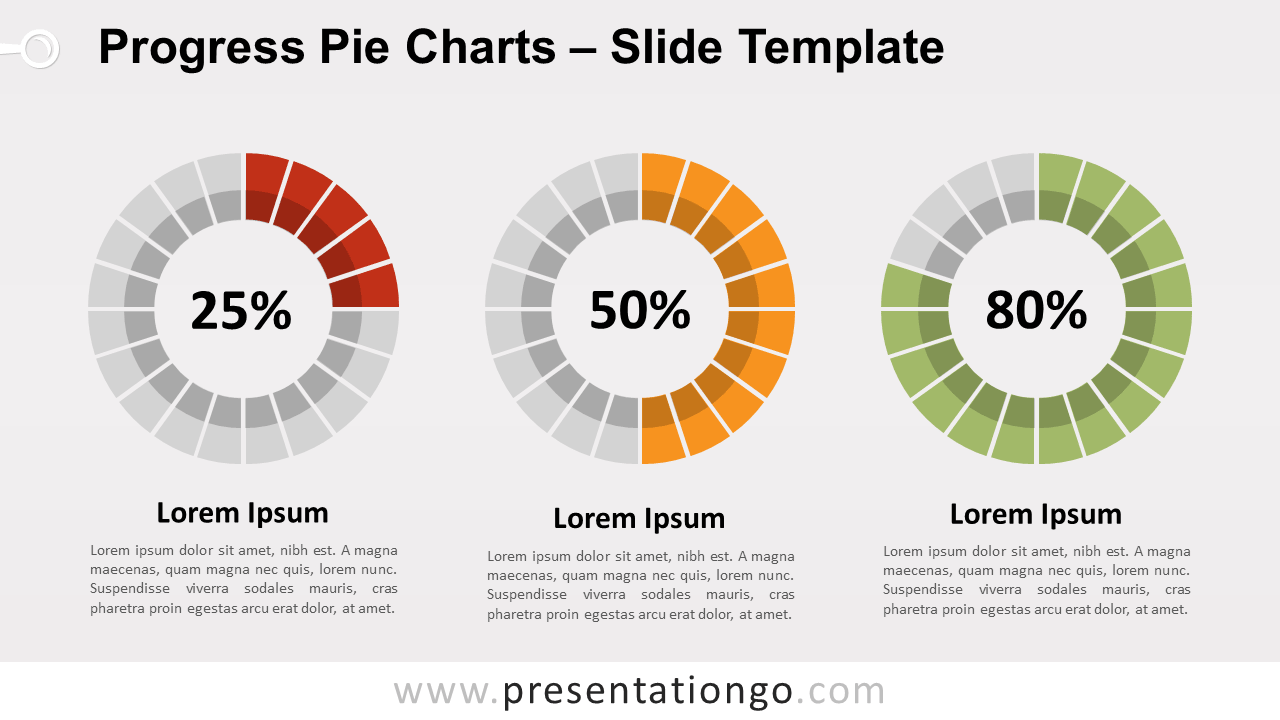
Free progress pie charts for PowerPoint and Google Slides. Donut pie chart with 20 editable slices. Non-data-driven chart alternative. Editable graphics.
テンプレートの詳細
Free progress pie charts for PowerPoint and Google Slides. Donut pie chart with 20 editable slices. Non-data-driven chart alternative. Editable graphics with text placeholders. Use these progress pie chart templates for quantitative results, to show percentages, completion results or progress. Great data visualization charts for a dashboard slide. Every single slice equals 5% – for example, to illustrate a 55% score, fill 11 shapes.
- 出典
- PresentationGo
- 形式
- pptx
- サイズ
- 115 KB
- ダウンロード数
- 0
- スライド枚数
- 2
- アスペクト比
- 16:9
タグ
作者 / 著作権:PresentationGo
元のページ:PresentationGo original