 100% 無料
Project Roadmap Gantt Chart
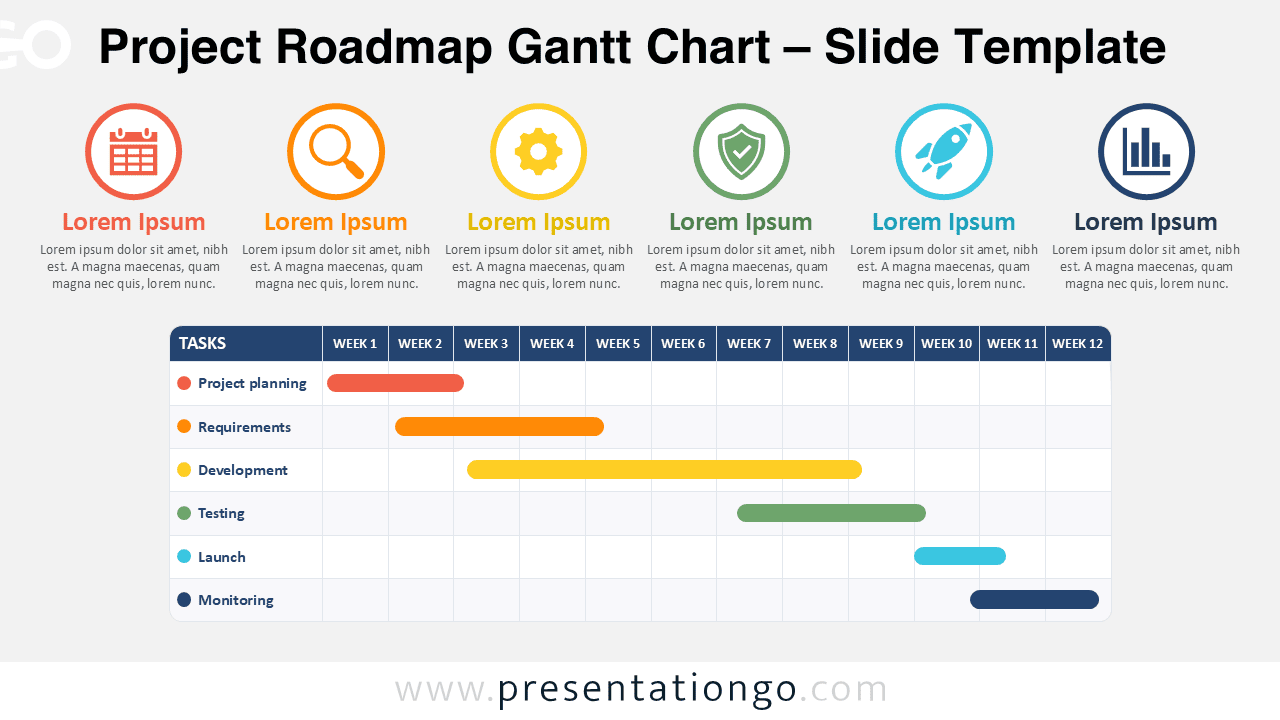
Download the Project Roadmap Gantt Chart for PowerPoint and Google Slides. Edit phases, tasks, icons, and a 12-week schedule for project planning teams.
テンプレートの詳細
The Project Roadmap Gantt Chart combines high-level project phases with a detailed 12-week schedule in one clear visual. Designed for PowerPoint and Google Slides, it helps presenters connect project activities with their timing without separating the roadmap from the schedule. The upper area introduces six distinct project phases with icons, headings, and short descriptions. The Gantt chart below then shows when each task begins, how long it lasts, and how activities relate across the project timeline.
- 出典
- PresentationGo
- 形式
- pptx
- サイズ
- 113 KB
- ダウンロード数
- 0
作者 / 著作権:PresentationGo
元のページ:PresentationGo original