 100% 無料
Project Timeline Gantt Chart
Download this Project Timeline Gantt Chart for PowerPoint and Google Slides to plan milestones, track tasks, and present schedules with confident clarity.
テンプレートの詳細
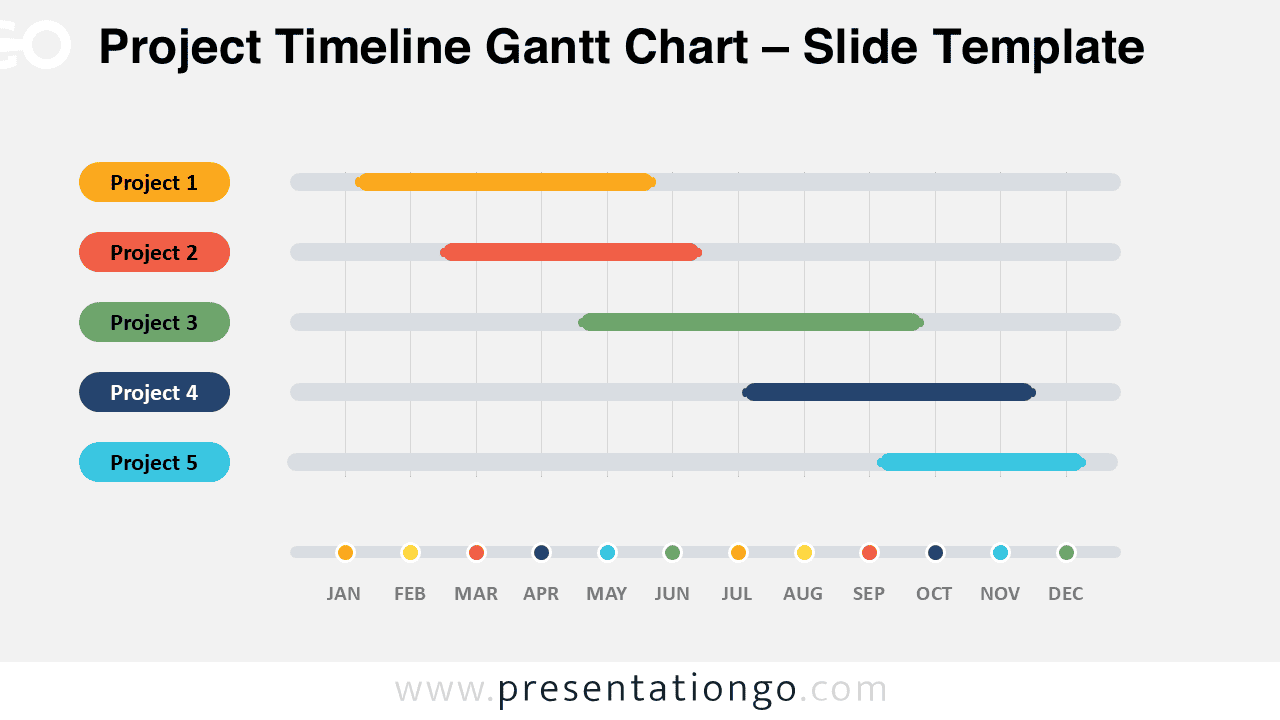
The Project Timeline Gantt Chart helps you present multiple project schedules in one clear view. It works well for PowerPoint and Google Slides. Use it to compare durations, show overlaps, and explain deadlines fast. This editable diagram gives teams a simple way to track work across twelve months. Each project appears on its own row. The timeline lets viewers understand timing without reading dense project notes.
- 出典
- PresentationGo
- 形式
- pptx
- サイズ
- 97 KB
- ダウンロード数
- 0
作者 / 著作権:PresentationGo
元のページ:PresentationGo original