 100% 無料
Pyramid Population Template for PowerPoint
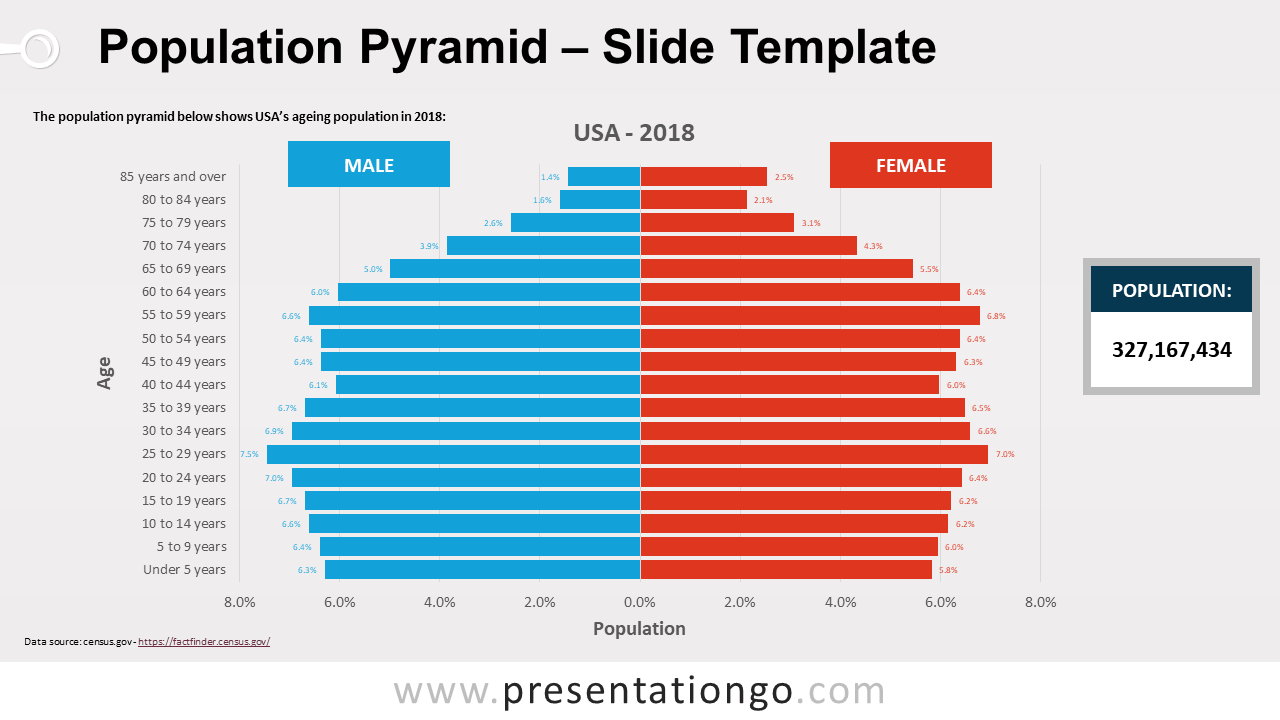
Free pyramid population template for PowerPoint. Data-driven bar chart to show the distribution of various age groups in a population. Editable graphics.
テンプレートの詳細
Free pyramid population template for PowerPoint. Data-driven bar chart to show the distribution of various age groups in a population. Editable graphics. The pyramid population, also known as the age-sex pyramid, is a chart where two sets of data series (male and female) are displayed side by side. This graphical illustration makes the distribution of the 2 age groups very easy to compare. It is made with PowerPoint data-driven bar chart : you can easily edit and change data series and format . This template features the United States age structure in 2018 (real data from Census).
- 出典
- PresentationGo
- 形式
- pptx
- サイズ
- 98 KB
- ダウンロード数
- 0
- スライド枚数
- 2
- アスペクト比
- 16:9
作者 / 著作権:PresentationGo
元のページ:PresentationGo original