 100% 無料
Real Donut Chart for PowerPoint
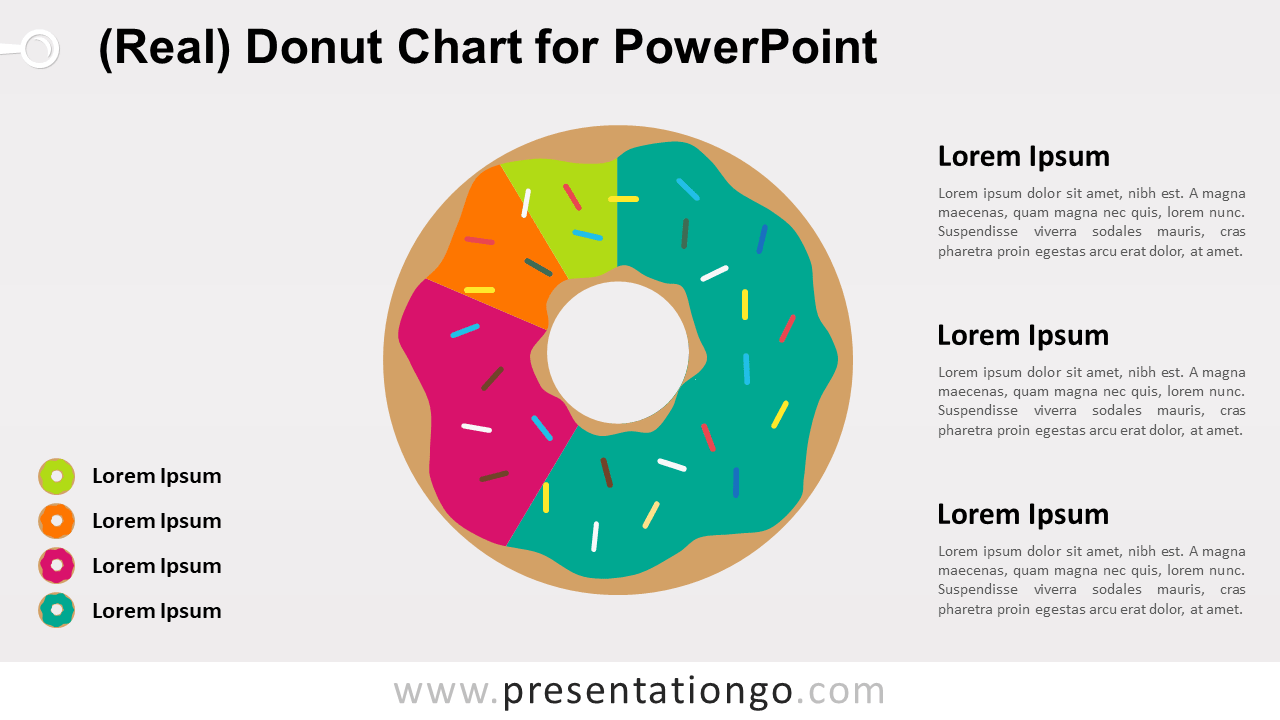
Show-off your creativity. Free real donut chart for PowerPoint. Colorful donut (or doughnut) design with data-driven pie chart. Standard and Widescreen.
テンプレートの詳細
Free (real) donut chart for PowerPoint. Colorful donut (or doughnut) design with data-driven pie chart. Editable graphics with text placeholder. Use this chart in your presentation for quantitative results about (unhealthy, junk) food, bakery, diet, for example. Or use it just to show-off your creativity ! Built-in data driven PowerPoint chart: you can easily change data series and format (e.g., colors). Click on the shape to change the background color – to fit yours. Then, just right-click the chart to edit the data series ( Edit Data ):
- 出典
- PresentationGo
- 形式
- pptx
- サイズ
- 127 KB
- ダウンロード数
- 0
- スライド枚数
- 2
- アスペクト比
- 16:9
作者 / 著作権:PresentationGo
元のページ:PresentationGo original