 100% 無料
Segmented Scale Dashboard
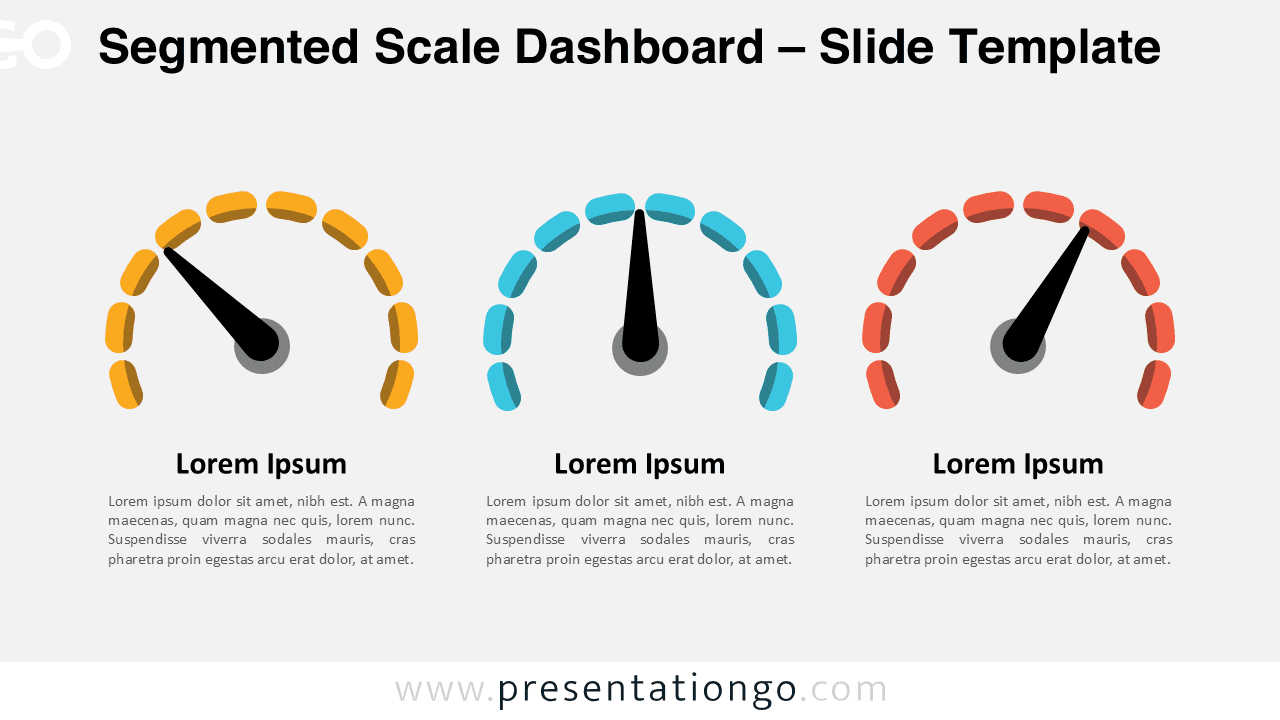
Present your KPIs effectively using the Segmented Scale Dashboard for PowerPoint and Google Slides with three customizable gauges.
テンプレートの詳細
The Segmented Scale Dashboard provides a creative three-step gauge diagram designed for PowerPoint and Google Slides to visually showcase progress and performance. Dashboards like these are ideal for representing performance metrics, tracking goals, or comparing key performance indicators in business and academic settings. For example, a sales manager can visually depict monthly target achievements, while a teacher might use it to illustrate student progress in different subjects. By offering a clear visual cue, this dashboard is an effective alternative to numerical tables for presentations requiring a non-data-driven approach. The template includes two unique slides pre-populated with text placeholders, fully customizable shapes, and non-data-driven pie charts. It offers both light and dark theme options and comes in Standard (4:3) and Widescreen (16:9) formats. Compatible with PowerPoint PPTX and Google Slides, it provides users with versatile customization options.
テンプレートの特徴
- 2 unique slides
- Options for both light and dark themes
- Pre-populated with text placeholders
- Fully customizable shapes for complete control
- Available in both Standard (4:3) and Widescreen (16:9) ratios
- Offered in both PowerPoint PPTX and Google Slides formats
- 出典
- PresentationGo
- 形式
- pptx
- サイズ
- 140 KB
- ダウンロード数
- 0
- スライド枚数
- 2
- アスペクト比
- 16:9
作者 / 著作権:PresentationGo
元のページ:PresentationGo original