 100% 無料
Simple Equalizer Diagram for PowerPoint and Google Slides
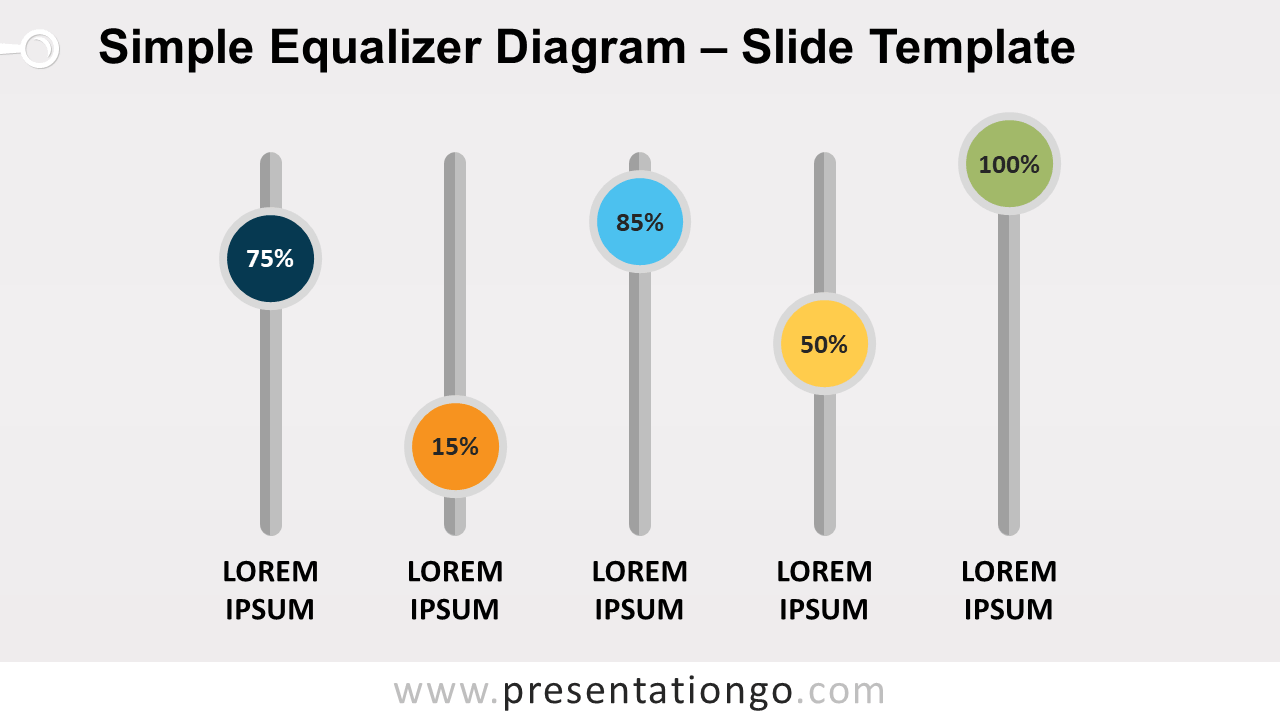
Free simple equalizer diagram for PowerPoint. 5 vertical bars with circles to be manually adjusted for the required (custom) frequency. Editable graphics.
テンプレートの詳細
Free simple equalizer diagram for PowerPoint and Google Slides. Five (5) vertical bars with circles to be manually adjusted for the required (custom) frequency. Non-data-driven chart alternative. Editable graphics with text placeholders. Use this chart for quantitative results, to show and compare percentages for example.
- 出典
- PresentationGo
- 形式
- pptx
- サイズ
- 70 KB
- ダウンロード数
- 0
- スライド枚数
- 2
- アスペクト比
- 16:9
作者 / 著作権:PresentationGo
元のページ:PresentationGo original