 100% 無料
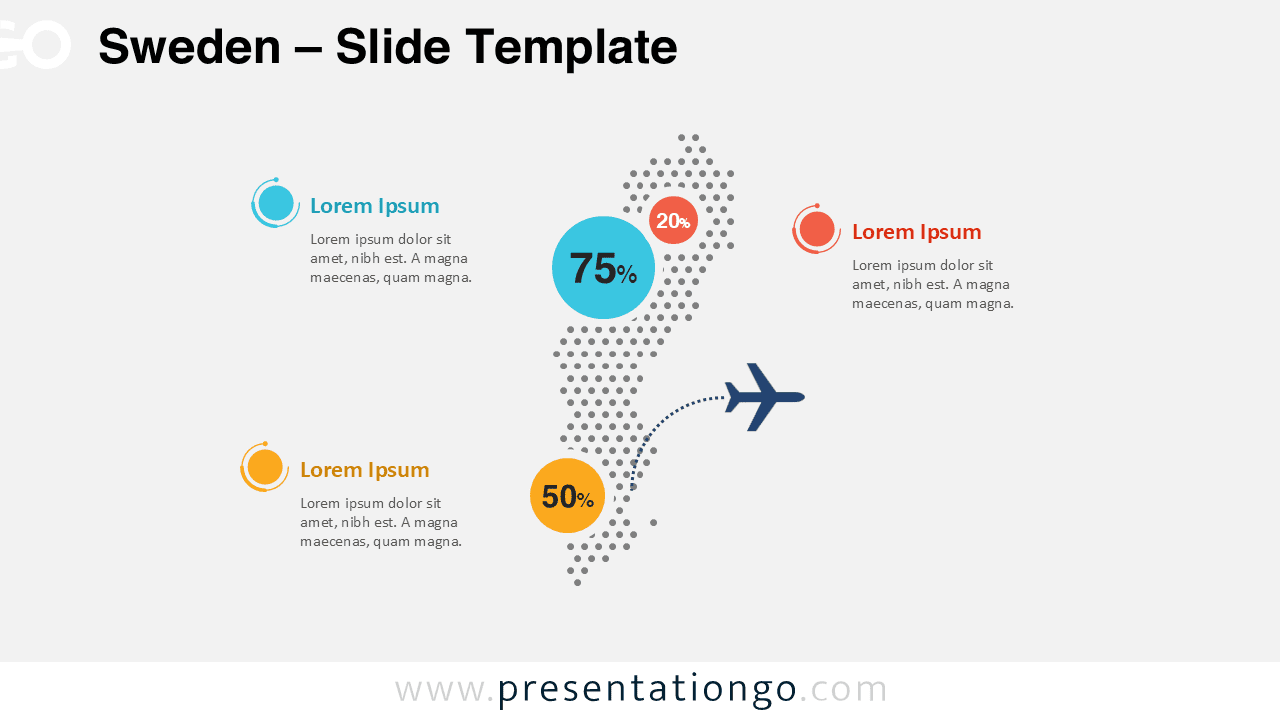
Sweden Dotted Map Infographic
Download this free Sweden Dotted Map Infographic for PowerPoint and Google Slides. Highlight regions, statistics, travel routes, and market data fast.
テンプレートの詳細
Sweden Dotted Map Infographic offers a clean and modern way to present geographic information in PowerPoint and Google Slides. The design uses a dotted silhouette of Sweden, bold percentage markers, and simple text areas that stay easy to edit. It helps you turn regional data into a visual story that feels clear, professional, and presentation-ready. You can replace the sample text with city names, regional notes, business metrics, or travel highlights in minutes. The layout stays focused and readable, which makes it useful for both quick overviews and more detailed location-based presentations.
- 出典
- PresentationGo
- 形式
- pptx
- サイズ
- 114 KB
- ダウンロード数
- 0
作者 / 著作権:PresentationGo
元のページ:PresentationGo original