 100% 無料
Waffle Chart for PowerPoint and Google Slides
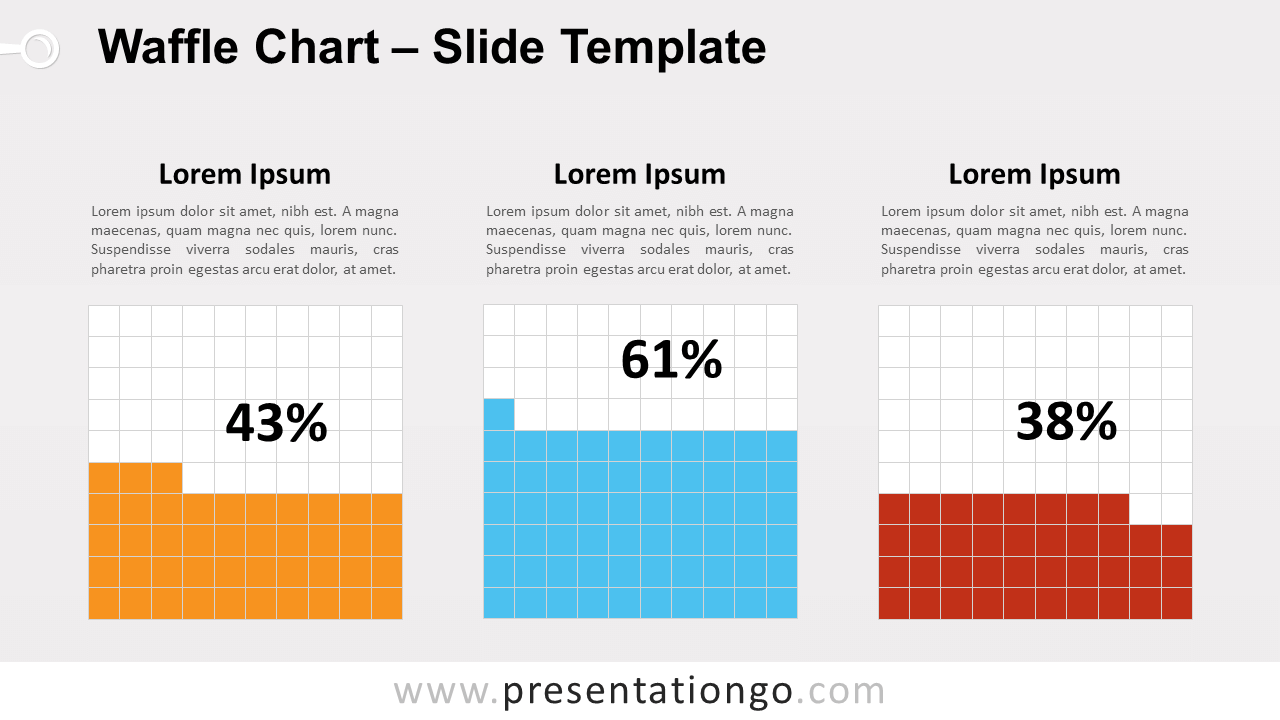
Free waffle chart for PowerPoint and Google Slides. Grids of 10x10 small cells with colored ones. Great to visualize and compare quantitative data.
テンプレートの詳細
Free waffle chart for PowerPoint and Google Slides. Three grids of 10×10 small cells with colored ones to represent the data. Great to visualize and compare quantitative data. Editable graphics with text placeholders. Waffle charts are very powerful infographics for data visualization . They are indeed very convenient charts to visualize and easily understand quantitative data, mainly a percentage. They are also sometimes used to illustrate progress toward a goal. More specifically, these waffle charts represent three 10 x 10 cell grids, displayed side-by-side. They are very simple and straightforward charts: each box represents 1 percentage point summing up to a total of 100%. The vivid color of the grid will show the data. You will find in the document the grid with 2 design variants: squares and circles. Finally, the 3 grids put together on the same slide allow you to compare different data.
- 出典
- PresentationGo
- 形式
- pptx
- サイズ
- 108 KB
- ダウンロード数
- 0
- スライド枚数
- 3
- アスペクト比
- 16:9
作者 / 著作権:PresentationGo
元のページ:PresentationGo original