 100% 無料
Wine Glass Charts
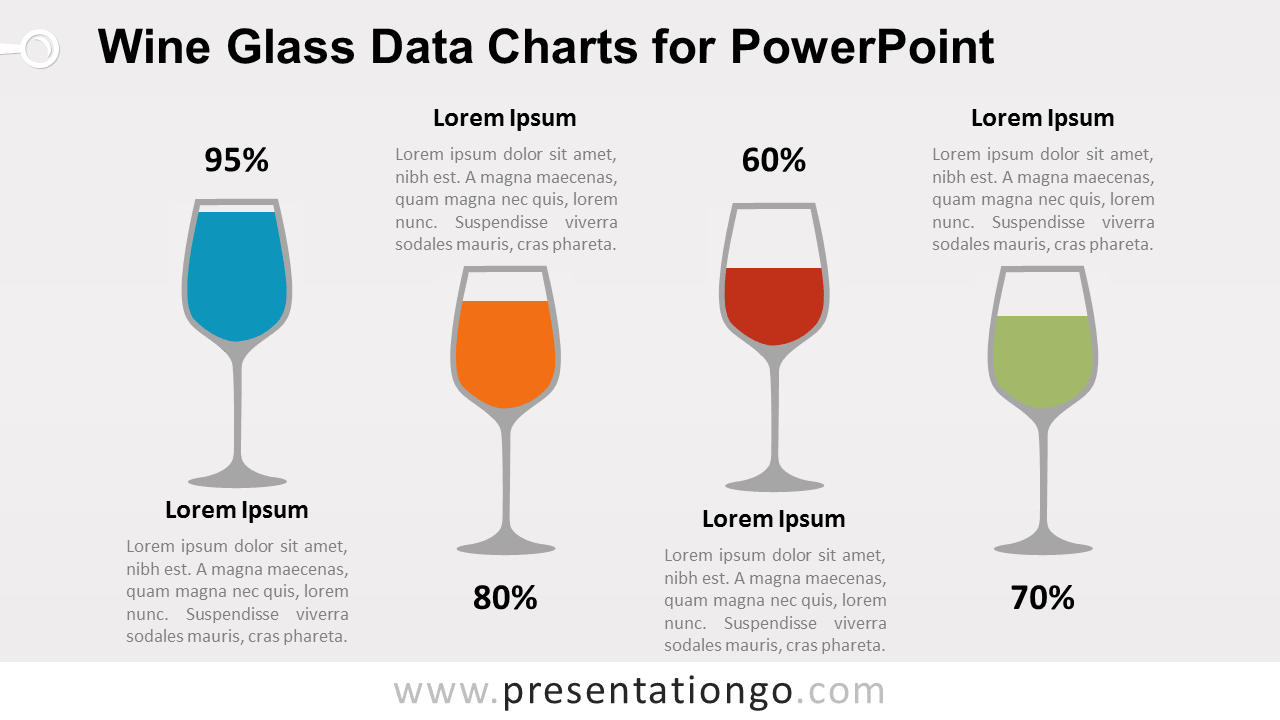
Download Wine Glass Charts for PowerPoint with editable data-driven charts, 2 slides, and wine glass visuals for percentage comparison presentations.
テンプレートの詳細
The Wine Glass Charts for PowerPoint present four percentage values through wine glass-shaped data-driven charts. Each glass combines a visual fill level, percentage label, heading, and supporting text. The layout works well for comparing performance, survey results, KPIs, completion rates, category values, or other quantitative data in a more visual format.
- 出典
- PresentationGo
- 形式
- pptx
- サイズ
- 173 KB
- ダウンロード数
- 0
タグ
作者 / 著作権:PresentationGo
元のページ:PresentationGo original