 100% 무료
7-Week Gantt Chart
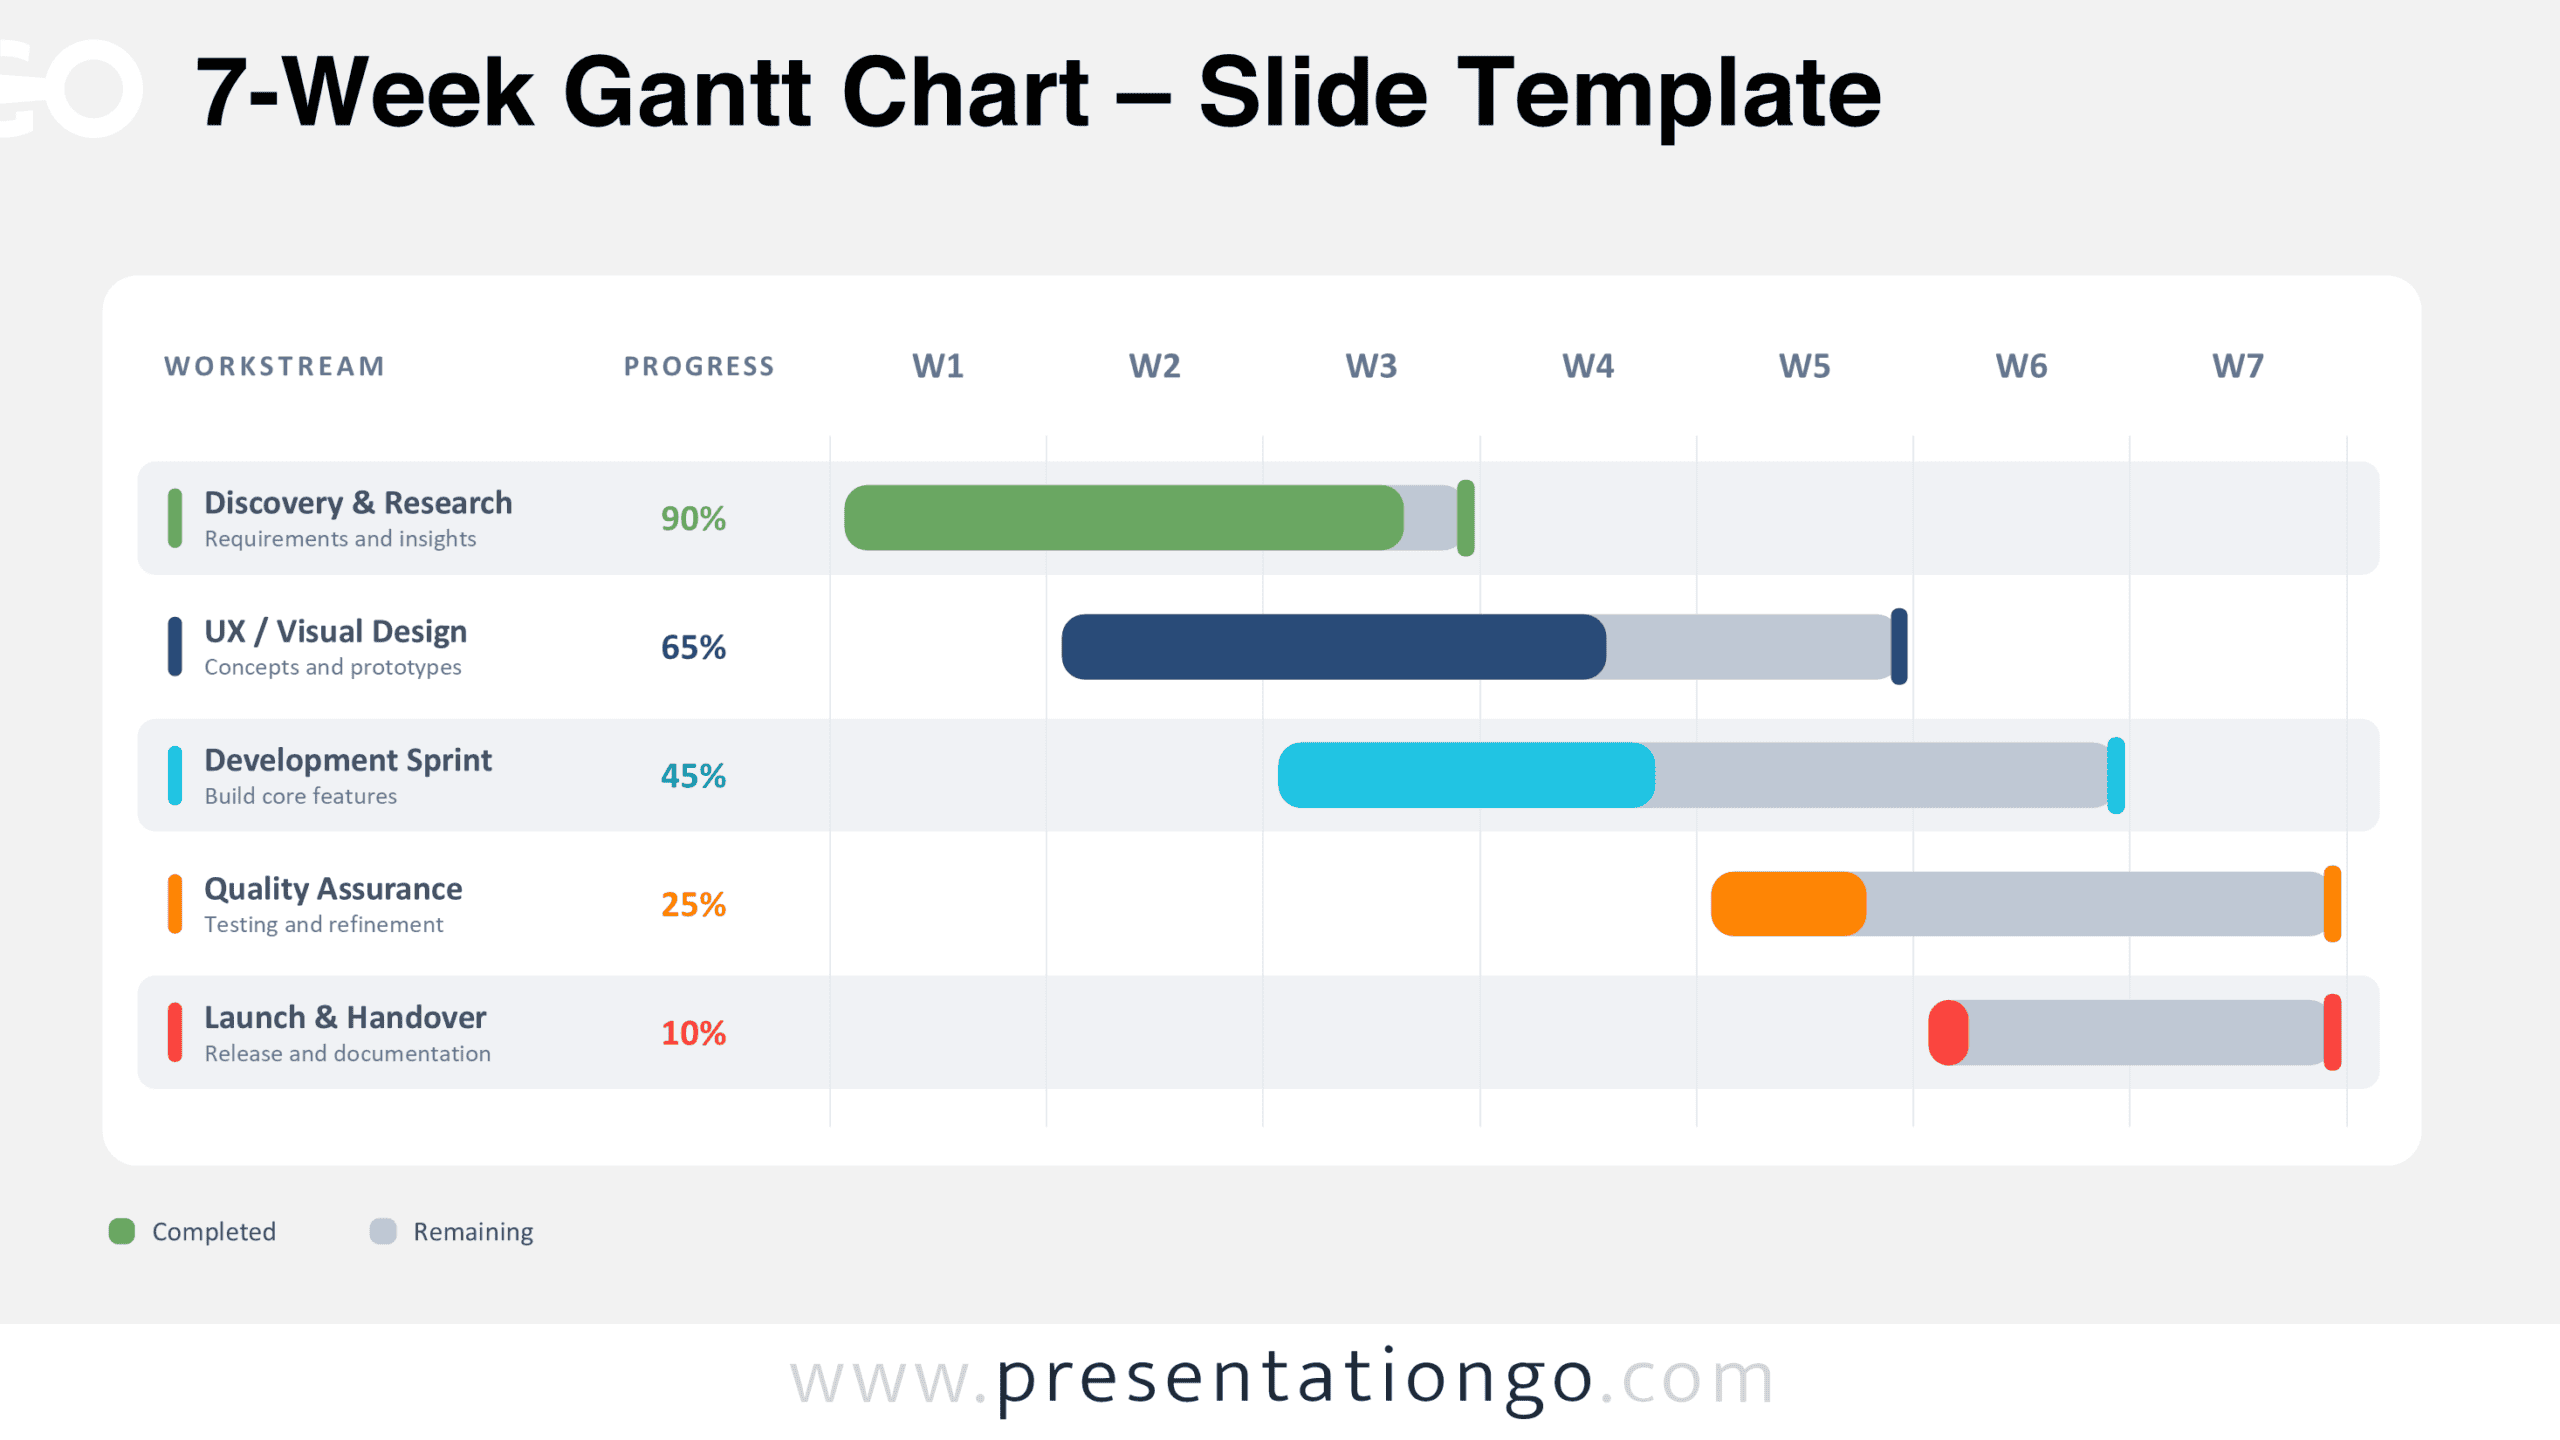
Download a free 7-Week Gantt Chart for PowerPoint and Google Slides. Visualize task schedules, compare workstream progress, and plan seven project weeks.
템플릿 상세
The 7-Week Gantt Chart is a free, editable project scheduling diagram for PowerPoint and Google Slides. It displays five workstreams across seven weeks, combining task timelines with completion percentages. Use it to track ongoing activities, review project status, and communicate schedules during team meetings or stakeholder presentations. The 7-Week Gantt Chart comes in two slide versions with the same layout and information hierarchy. Both display a complete project schedule, making it easy to choose the version that fits your existing presentation.
- 출처
- PresentationGo
- 형식
- pptx
- 파일 크기
- 94 KB
- 다운로드
- 0
제작자 / 저작권:PresentationGo
원본 링크:PresentationGo original