 100% 무료
Annual Project Gantt Chart
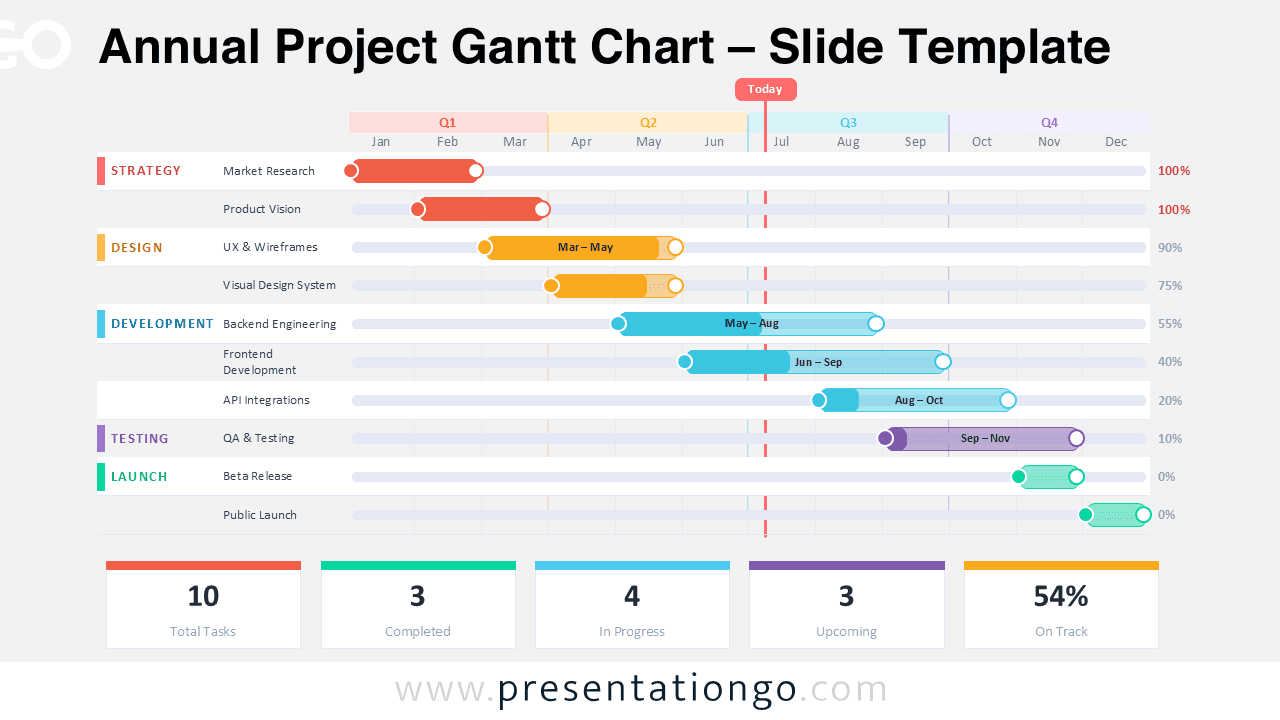
Visualize yearly planning with this Annual Project Gantt Chart for PowerPoint and Google Slides. Track milestones, tasks, and progress across the full year.
템플릿 상세
Planning a full year of initiatives requires a clear and structured visual timeline. The Annual Project Gantt Chart for PowerPoint and Google Slides helps you present project schedules, milestones, and development phases in a simple and professional way. This diagram is designed to visualize projects that span an entire year. Tasks appear as horizontal bars distributed across months, allowing audiences to quickly understand timelines, progress, and dependencies. The layout is ideal for business planning, product development roadmaps, and strategic project presentations.
- 출처
- PresentationGo
- 형식
- pptx
- 파일 크기
- 105 KB
- 다운로드
- 0
제작자 / 저작권:PresentationGo
원본 링크:PresentationGo original