 100% 무료
Battery Chart for PowerPoint and Google Slides
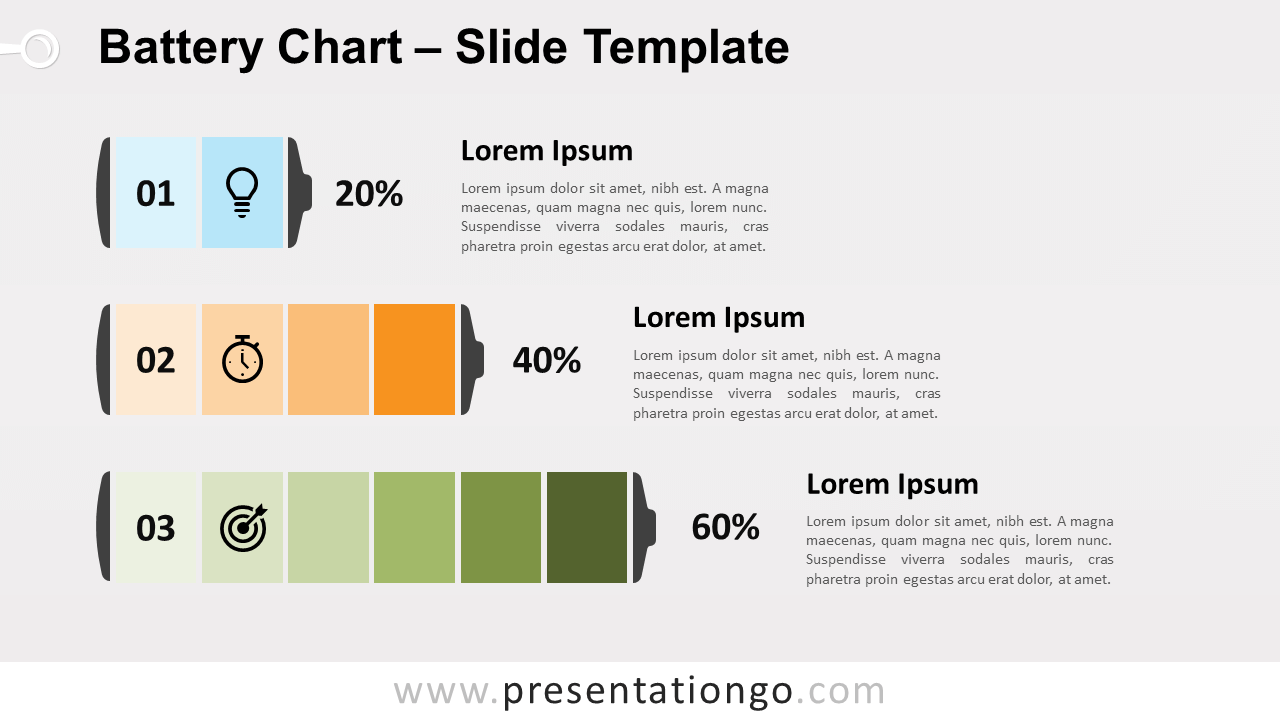
Free battery chart for PowerPoint and Google Slides. Customizable fragmented battery. Each part represents a fraction of a numerical value.
템플릿 상세
Free battery chart for PowerPoint and Google Slides. Design of a fragmented battery. Each part represents a fraction of a numerical value. Easy-to-customize editable graphics with numbers, icons, and text placeholders. This non-data-driven chart uses a popular symbol for data visualization: the battery symbol. As a matter of fact, most people know how it works since the battery icon is present in most digital devices. As a result, the battery is a symbol that is very easy to understand when combined to quantitative data. More specifically, this infographic illustration shows a battery with 2 to 6 fractions. And the length of each bar is proportionate to the numerical value or percentage that it represents. You can use it to illustrate quantitative results , to show percentages, completion results, or progress. Shapes are 100% editable : colors and sizes can be easily changed. And obviously, you can adapt the number of bars as you wish.
- 출처
- PresentationGo
- 형식
- pptx
- 파일 크기
- 83 KB
- 다운로드
- 0
- 슬라이드 수
- 2
- 비율
- 16:9
제작자 / 저작권:PresentationGo
원본 링크:PresentationGo original