 100% 무료
Chemical Tube Test Charts
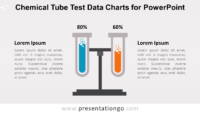
Free chemical tube test charts for PowerPoint. 2 tube tests with on a stand. Data-driven charts. Great for healthcare, science, business PPTX presentations.
템플릿 상세
The Chemical Tube Test Charts for PowerPoint combine laboratory-inspired test tube graphics with built-in data-driven charts. Two test tubes display separate values, while percentage labels and supporting text help explain each result. The layout works well for experiments, sample comparisons, research findings, measurements, scientific data, and other two-part quantitative comparisons. The Chemical Tube Test Charts use two test tube illustrations mounted on a central laboratory stand. Each tube represents one value and includes a percentage label above it. Text areas on both sides provide room for headings, explanations, findings, or supporting notes. This balanced arrangement makes the comparison easy to scan while keeping the scientific theme visible. Unlike a static infographic, the visual includes built-in data-driven PowerPoint charts. You can change the underlying data series and adjust chart formatting directly in PowerPoint. The liquid levels can therefore reflect your own values rather than serving only as decorative shapes. You can also edit the percentage labels, text, shapes, dimensions, and other visual elements. Both 16:9 and 4:3 slide sizes are included for different presentation formats. The Chemical Tube Test Charts provide an editable, data-driven PowerPoint solution for comparing two quantitative results. The test tube graphics, percentage labels, chart data, and supporting text areas make the slides useful for scientific, educational, technical, and research presentations.
- 출처
- PresentationGo
- 형식
- pptx
- 파일 크기
- 118 KB
- 다운로드
- 0
제작자 / 저작권:PresentationGo
원본 링크:PresentationGo original