 100% 무료
Comparative Bar Charts for PowerPoint and Google Slides
Free comparative bar charts for PowerPoint and Google Slides. A simple and easy-to-read option to share and compare quantitative results.
템플릿 상세
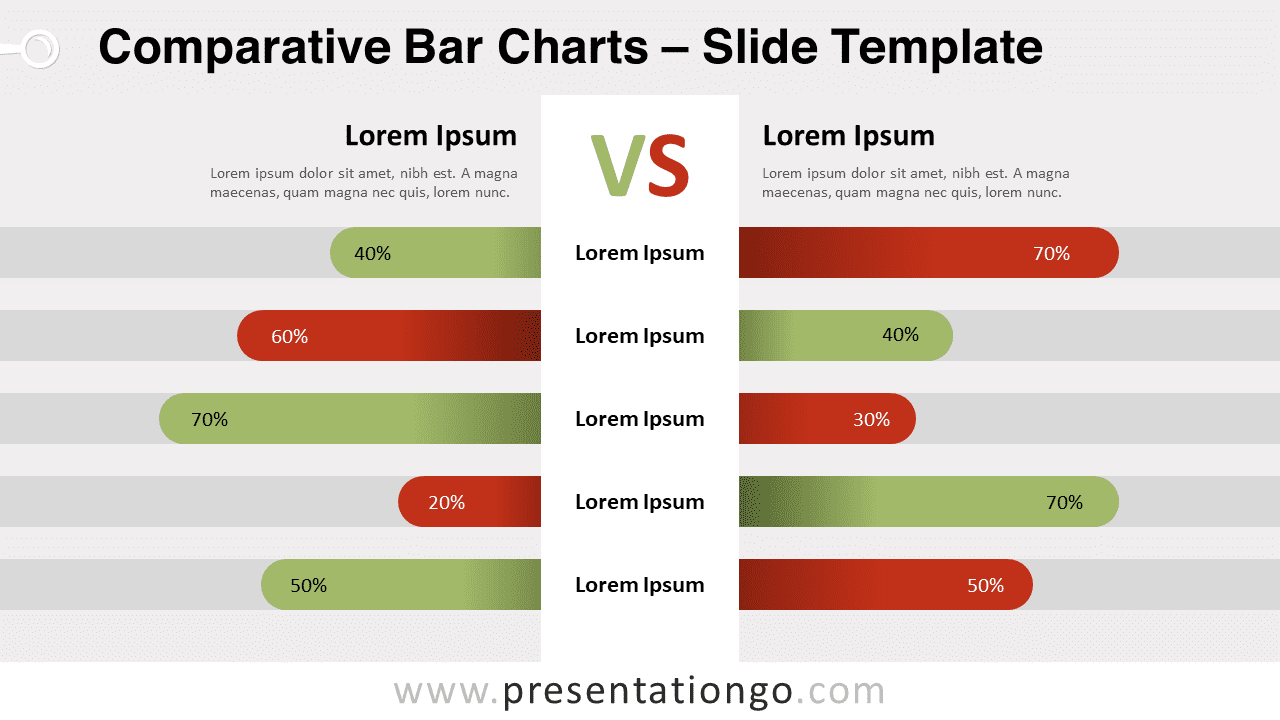
Free comparative bar charts for PowerPoint and Google Slides. A simple and easy-to-read option to share and compare quantitative results. Editable graphics with text placeholders. Nothing compares to a clear chart to show your quantitative results to your audience! This free Comparative Bar Charts template offers a perfect design to share your numbers and percentages and make comparisons. In the middle of this slide stands a white column in which you can write the name of the items you would like to compare. You can indeed include up to 5 of them. On both sides stand 5 horizontal lines that you can color to show positive and negative results. Moreover, you can directly write the number or percentage inside these bars. Finally, you have 2 spaces at the top to write titles and text in order to describe the two products, services, or items you are comparing. This free Comparative Bar Charts template is a simple and easy-to-read option for you to share and compare quantitative results. A perfect tool for data visualization !
- 출처
- PresentationGo
- 형식
- pptx
- 파일 크기
- 74 KB
- 다운로드
- 0
- 슬라이드 수
- 2
- 비율
- 16:9
제작자 / 저작권:PresentationGo
원본 링크:PresentationGo original