 100% 무료
Infographic Arc Charts for PowerPoint and Google Slides
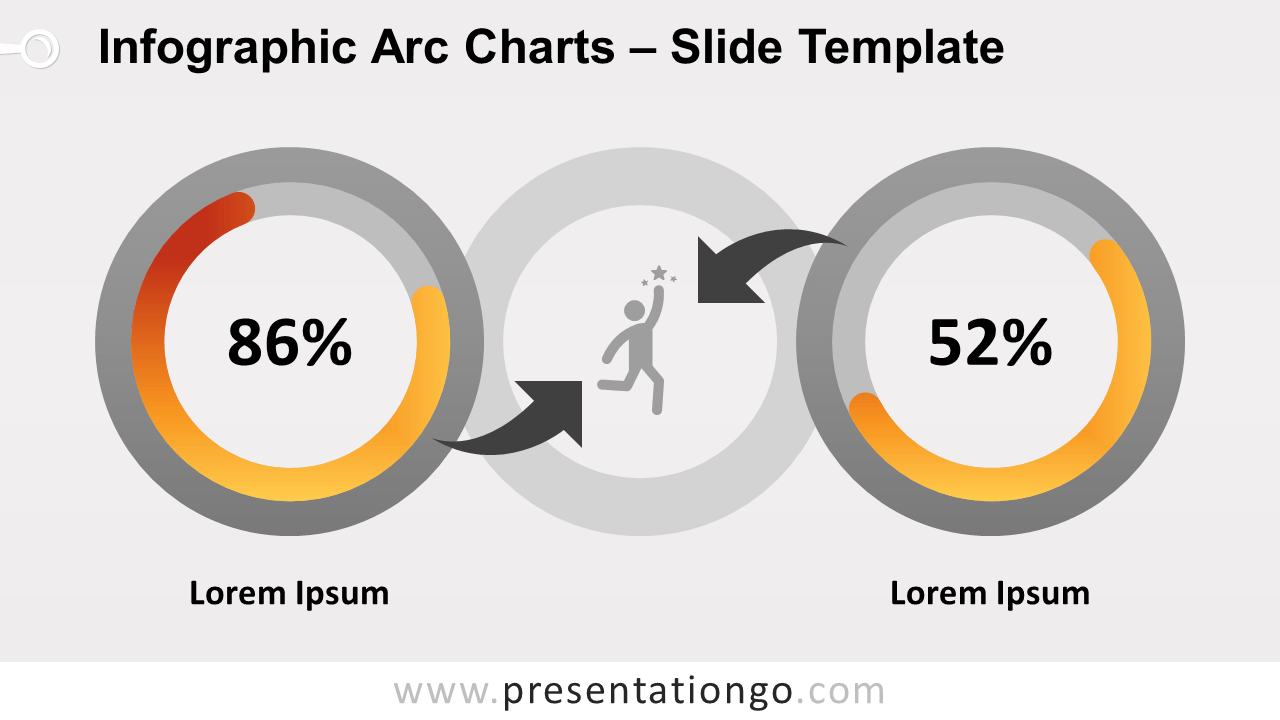
Free infographic arc charts for PowerPoint and Google Slides. Stylish single circular gauge charts designed with adjustable arc shapes. Editable graphics.
템플릿 상세
Free infographic arc charts for PowerPoint and Google Slides. Two side-by-side stylish single circular gauge charts designed with adjustable arc shapes. Editable graphics. A circular gauge chart looks like a circular bar chart. This type of chart is commonly used in data visualization infographics. Indeed, circular gauge charts provide at a glance easy data reading. More specifically, this infographic template slide showcases two charts. Since they are displayed side-by-side, the comparison of results is very easy to visualize. Also, each gauge chart has a blank area in the middle to display the value of the series. Another alternative is to insert a custom icon in this middle cutout. The choice is yours! Finally, a gray full ring stands right between the 2 charts. In this circle shape, you can use another custom icon.
- 출처
- PresentationGo
- 형식
- pptx
- 파일 크기
- 81 KB
- 다운로드
- 0
- 슬라이드 수
- 2
- 비율
- 16:9
제작자 / 저작권:PresentationGo
원본 링크:PresentationGo original