 100% 무료
Light Bulb Chart for PowerPoint
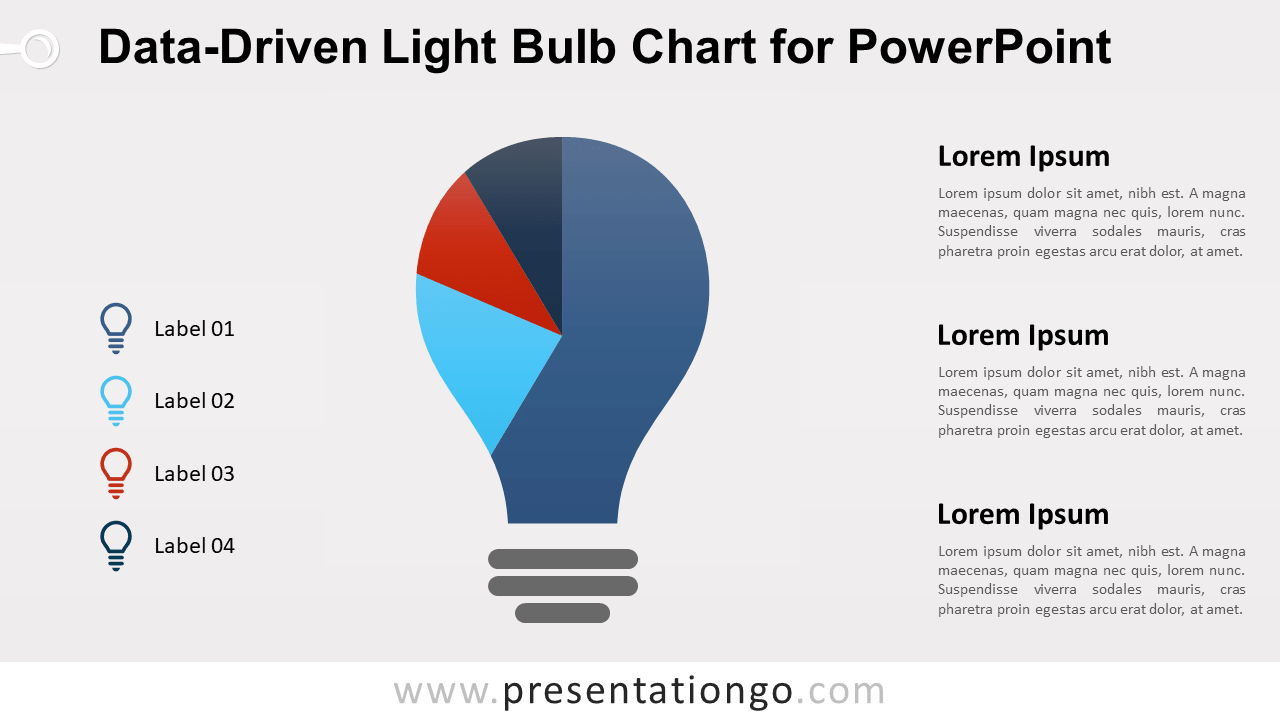
Free light bulb chart for PowerPoint. Bulb design made with a data-driven pie chart. Infographic metaphor for ideas, innovation. 100% editable graphics.
템플릿 상세
Free light bulb chart for PowerPoint. Bulb design made with a data-driven pie chart. Editable graphics with text placeholder. Use this creative chart in your presentation for quantitative results about (bright) ideas , innovations, or about electricity, for example. Built-in data driven PowerPoint chart: you can easily change data series and format (e.g., colors). Click on the shape to change the background color – to fit yours. Then, just right-click the chart to edit the data series ( Edit Data ):
- 출처
- PresentationGo
- 형식
- pptx
- 파일 크기
- 164 KB
- 다운로드
- 0
- 슬라이드 수
- 2
- 비율
- 16:9
제작자 / 저작권:PresentationGo
원본 링크:PresentationGo original