 100% 무료
Multi-Dimensional Clock Chart for PowerPoint and Google Slides
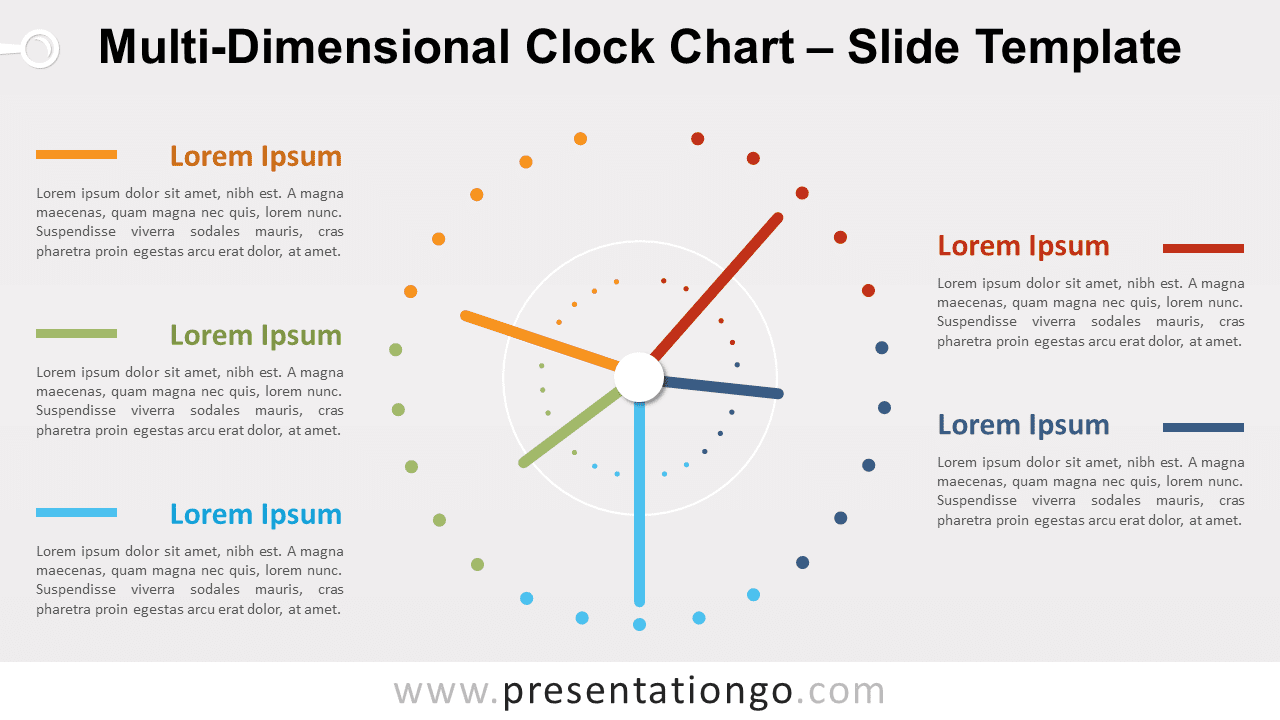
Free multi-dimensional clock chart for PowerPoint and Google Slides. An original data visualization graphic to showcase multivariate data.
템플릿 상세
Free multi-dimensional clock chart for PowerPoint and Google Slides. An original data visualization graphic to showcase multivariate data. Editable graphics with text placeholders. This clock won’t give you the time, but it will offer you so many things! For instance, this free Multi-Dimensional Clock Chart template is ideal to show quantitative results to your public. This slide shows a large circular shape in the center made of 20 dots. These dots are divided into 5 colors, creating 5 zones with 5 hands. Therefore, you have options to show 5 different numbers or data. You can decide both on the length and direction of the clock hands, thus creating a multi-dimensional diagram for data visualization. Besides, you can specify your facts and numbers with 5 text placeholders on the sides. Just like radar charts, this infographic is an original tool to showcase and compare various features or characteristics. Thanks to this free Multi-Dimensional Clock Chart template, your audience won’t watch their clock out of boredom but at yours out of interest.
- 출처
- PresentationGo
- 형식
- pptx
- 파일 크기
- 81 KB
- 다운로드
- 0
- 슬라이드 수
- 2
- 비율
- 16:9
제작자 / 저작권:PresentationGo
원본 링크:PresentationGo original