 100% 무료
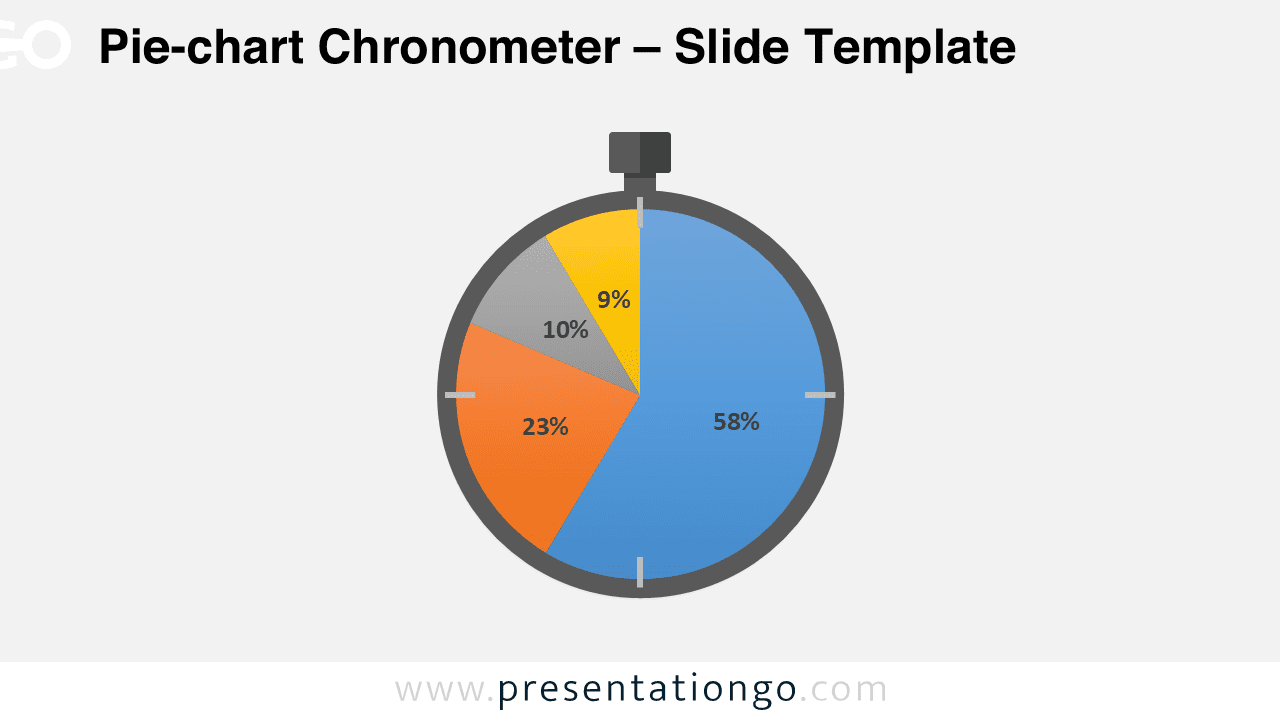
Pie-chart PowerPoint Chronometer
Free pie-chart PowerPoint chronometer. PowerPoint diagram using the chronometer shape as the contour of a built-in data driven pie-chart.
템플릿 상세
Free pie-chart PowerPoint chronometer. PowerPoint diagram using the chronometer shape as the contour of a built-in data driven pie-chart. As a built-in data driven PowerPoint chart, you can easily change data series and format: 1. Click anywhere in your chart. 2. Click the Chart Filters button Chart Filters button next to the chart. 3. On the Values tab, check or uncheck the series or categories you want to show or hide. Values tab in the Chart Filters gallery 4. Click Apply. 5. If you want to edit or rearrange the data in your series, click Select Data, and then follow steps 2-4 in the next section. You can also get to this dialog box from the Value tab in the Chart Filters gallery. Select Data Source dialog box 2. In the Legend Entries (Series) box, click the series you want to change. 3. Click Edit, make your changes, and click OK. 4. To rearrange a series, select it, and then click Move Up Move Up button or Move Down Move Down button. Like a pie chart, a doughnut chart shows the relationship of parts to a whole, but it can contain more than one data series. Doughnut charts show data in rings, where each ring represents a data series. If percentages are shown in data labels, each ring will total 100%.
- 출처
- PresentationGo
- 형식
- pptx
- 파일 크기
- 62 KB
- 다운로드
- 0
- 슬라이드 수
- 1
- 비율
- 16:9
제작자 / 저작권:PresentationGo
원본 링크:PresentationGo original