 100% 무료
Progress-O-Meters
Download the Progress-O-Meters for PowerPoint and Google Slides to visualize performance data with color-coded gauges and indicators.
템플릿 상세
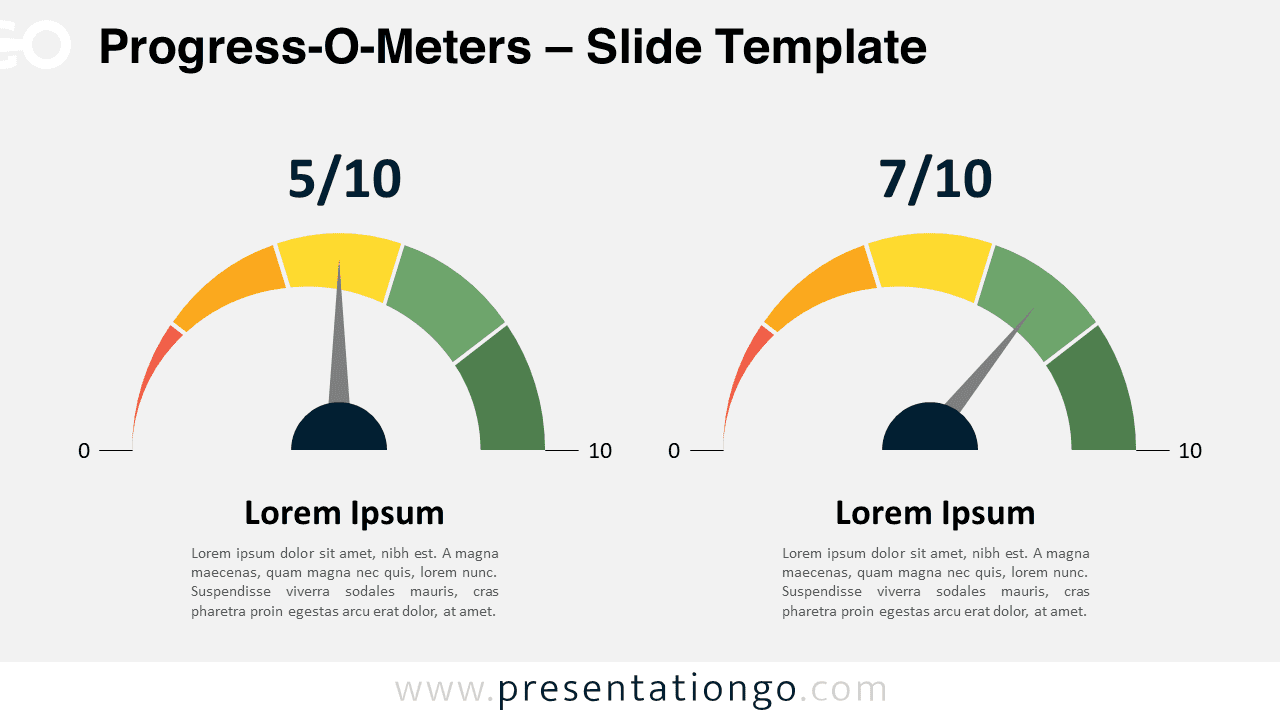
The Progress-O-Meters offer a dynamic way to display data in PowerPoint and Google Slides, featuring two angular gauges for comparative analysis. Angular gauges, akin to speedometers , serve as visual indicators of performance levels. The Progress-O-Meters template showcases a duo of semicircular dials, each segmented into four color-coded zones—red to green—symbolizing a spectrum from low to high. Central needles point to the measured value, providing a clear visual cue for assessment. This template is ideal for visualizing performance metrics in various contexts, such as business reports, educational presentations, or progress tracking in projects. By clearly indicating different levels, it helps audiences quickly grasp the data presented. For example, a business presentation might use these gauges to display sales performance, customer satisfaction levels, or progress towards goals. The template includes two unique slides, each pre-populated with numbers and text placeholders. Fully customizable shapes offer complete control over design elements. It comes in both light and dark themes, available in Standard (4:3) and Widescreen (16:9) ratios, and is offered in PowerPoint PPTX and Google Slides formats. Download Progress-O-Meters today and take your data visualization to the next level.
템플릿 특징
- 2 unique slides
- Options for both light and dark themes
- Pre-populated with numbers and text placeholders
- Fully customizable shapes for complete control
- Available in both Standard (4:3) and Widescreen (16:9) ratios
- Offered in both PowerPoint PPTX and Google Slides formats
- 출처
- PresentationGo
- 형식
- pptx
- 파일 크기
- 92 KB
- 다운로드
- 0
- 슬라이드 수
- 2
- 비율
- 16:9
제작자 / 저작권:PresentationGo
원본 링크:PresentationGo original