 100% 무료
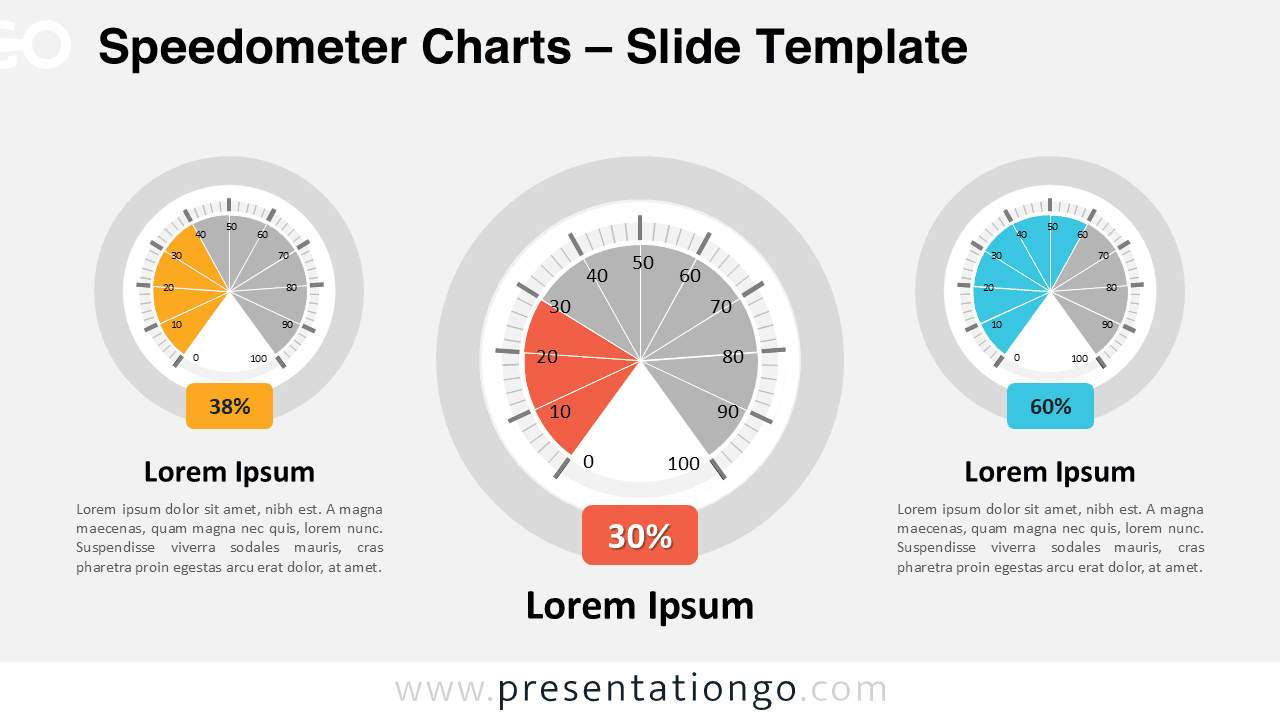
Speedometer Charts
Download this fully customizable Speedometer Charts template for PowerPoint & Google Slides. Ideal for dashboards and metric comparisons.
템플릿 상세
The Speedometer Charts template features three customizable radial gauges for PowerPoint and Google Slides, perfect for visualizing performance metrics, progress tracking, and comparative data analysis. Each chart includes a structured radial layout, numeric ranges from 0 to 100 for precision, and highlighted sections in contrasting colors to draw attention to specific data. The customizable percentage indicators below the charts and text placeholders enhance its utility by providing detailed insights into various metrics. Speedometers , commonly used to monitor performance metrics or display goal progression, are powerful visual tools for presentations. This template enables presenters to track and compare results across categories, making it particularly useful for team performance dashboards, sales progress reports, and KPI tracking in meetings. For example, it can effectively showcase quarterly sales goals, project progress, or task completion rates. This document includes 2 unique slides with pre-populated text placeholders. Shapes are fully customizable, and you can modify colors or numbers as needed. The template is compatible with both light and dark themes and available in standard (4:3) and widescreen (16:9) formats. It supports PowerPoint (PPTX) and Google Slides for easy use.
템플릿 특징
- 2 unique slides
- Options for both light and dark themes
- Pre-populated with text placeholders
- Fully customizable shapes for complete control
- Available in both Standard (4:3) and Widescreen (16:9) ratios
- Offered in both PowerPoint PPTX and Google Slides formats
- 출처
- PresentationGo
- 형식
- pptx
- 파일 크기
- 158 KB
- 다운로드
- 0
- 슬라이드 수
- 2
- 비율
- 16:9
제작자 / 저작권:PresentationGo
원본 링크:PresentationGo original