 100% 무료
Syringe Chart for PowerPoint
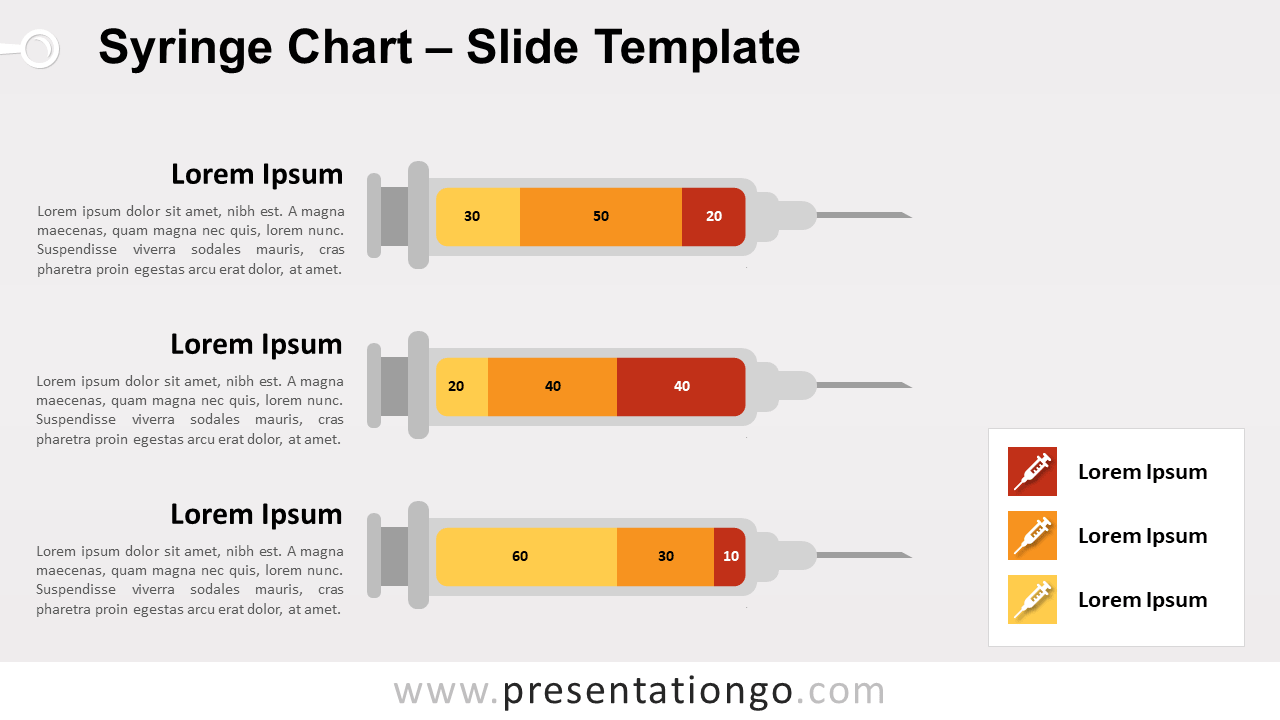
Free syringe chart for PowerPoint and Google Slides. 3 syringes and data-driven bar chart. Great for presentations about medicine, drugs, vaccine.
템플릿 상세
Free syringe chart for PowerPoint and Google Slides. Illustration of three (3) syringes with a needle and data-driven bar chart. Flat design style. Editable graphics with text placeholders. Use this infographic chart in your presentation to compare quantitative results . These syringe charts will be perfect for any topics related to medicine , healthcare, hospital, drugs, vaccine, or pharmacy. Built-in data driven PowerPoint chart: made with stacked bar chart, you can easily change data series and format (e.g., colors).
- 출처
- PresentationGo
- 형식
- pptx
- 파일 크기
- 146 KB
- 다운로드
- 0
- 슬라이드 수
- 2
- 비율
- 16:9
제작자 / 저작권:PresentationGo
원본 링크:PresentationGo original