 100% 무료
Three-Stage Serpentine Chart
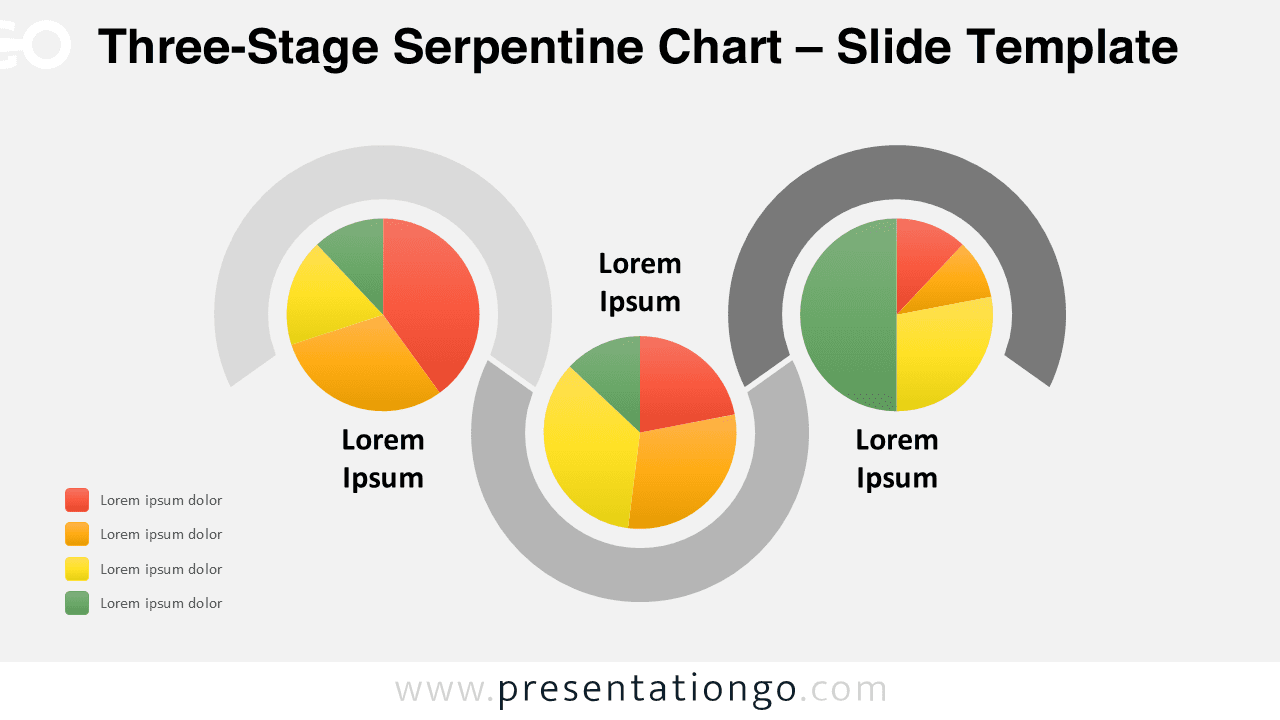
Download the free Three-Stage Serpentine Chart for PowerPoint and Google Slides to illustrate processes and workflows with pie charts.
템플릿 상세
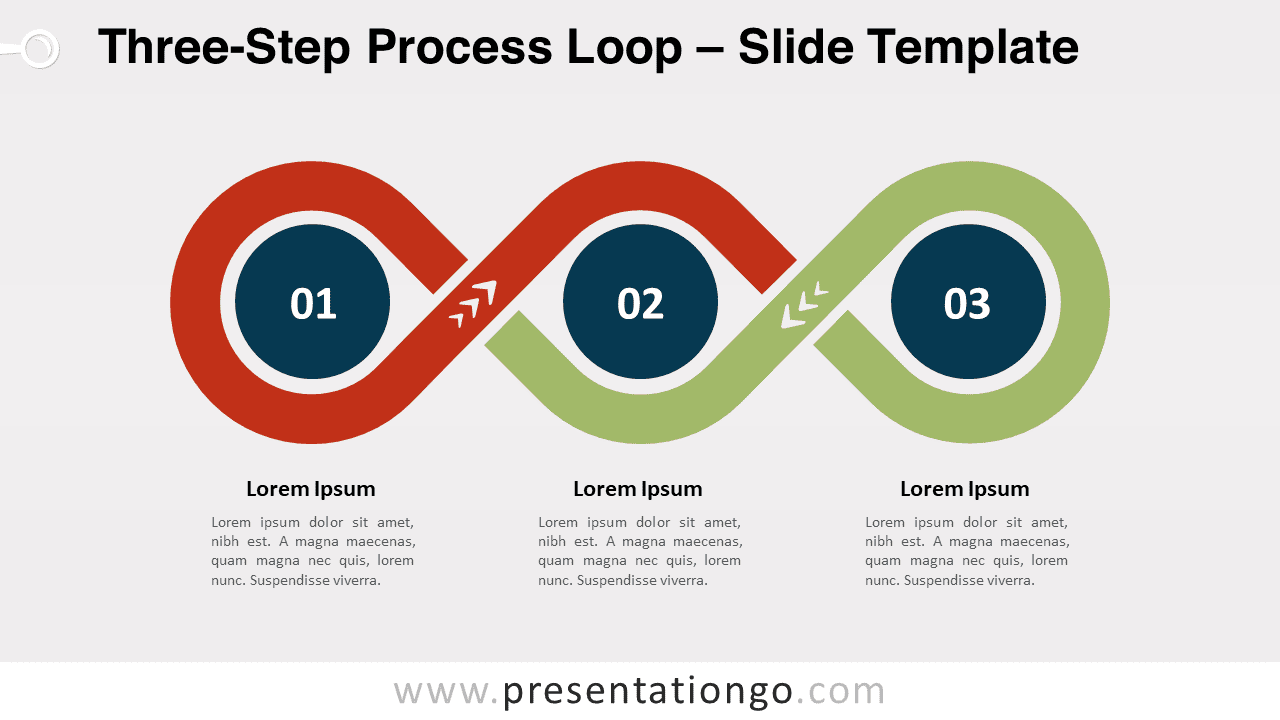
The Three-Stage Serpentine Chart visualizes data with three connected pie charts, designed for PowerPoint and Google Slides, to illustrate sequential processes and comparisons. This template features a visually distinctive serpentine flow composed of three connected steps, each highlighted by a data-driven pie chart. The partial circular arcs framing the charts create a wavy serpentine pattern, emphasizing a seamless progression. Each step includes editable text placeholders for customization, making the design dynamic yet easy to adapt for various presentation topics. Pie charts are excellent for presenting proportional data, and the Three-Stage Serpentine Chart combines this functionality with process visualization. This diagram is ideal for demonstrating workflows, processes, or segmented data in stages. For example, business professionals could use it to present quarterly performance metrics, while educators might apply it to illustrate step-by-step academic strategies. This template includes two unique slides, pre-designed with editable text placeholders. Shapes are fully customizable, allowing adjustments in size, colors, and arrangement. Data-driven pie charts ensure accurate visual representation of metrics, and both light and dark themes are available for flexibility. Additionally, it supports Standard (4:3) and Widescreen (16:9) formats, and it is fully compatible with PowerPoint (PPTX) and Google Slides.
템플릿 특징
- 2 unique slides
- Options for both light and dark themes
- Pre-populated with text placeholders
- Fully customizable shapes for complete control
- Data-driven pie-charts for dynamic data representation
- Available in both Standard (4:3) and Widescreen (16:9) ratios
- 출처
- PresentationGo
- 형식
- pptx
- 파일 크기
- 171 KB
- 다운로드
- 0
- 슬라이드 수
- 2
- 비율
- 16:9
제작자 / 저작권:PresentationGo
원본 링크:PresentationGo original